


 FxWirePro: USD/CAD runs out of steam but maintains bullish outlook
  GBPJPY Bullish Bias Stays Strong: Buy the 217 Dip, Target 220
  FxWirePro: EUR/AUD edges higher but outlook still bearish
  FxWirePro- Major Crypto levels and bias summary
  FxWirePro: GBP/NZD slips as Middle East tensions fuel risk aversion
  FxWirePro- Major Crypto levels and bias summary
  EUR/USD Slips Below 1.1380 as US-Iran Tensions Fuel Dollar Demand


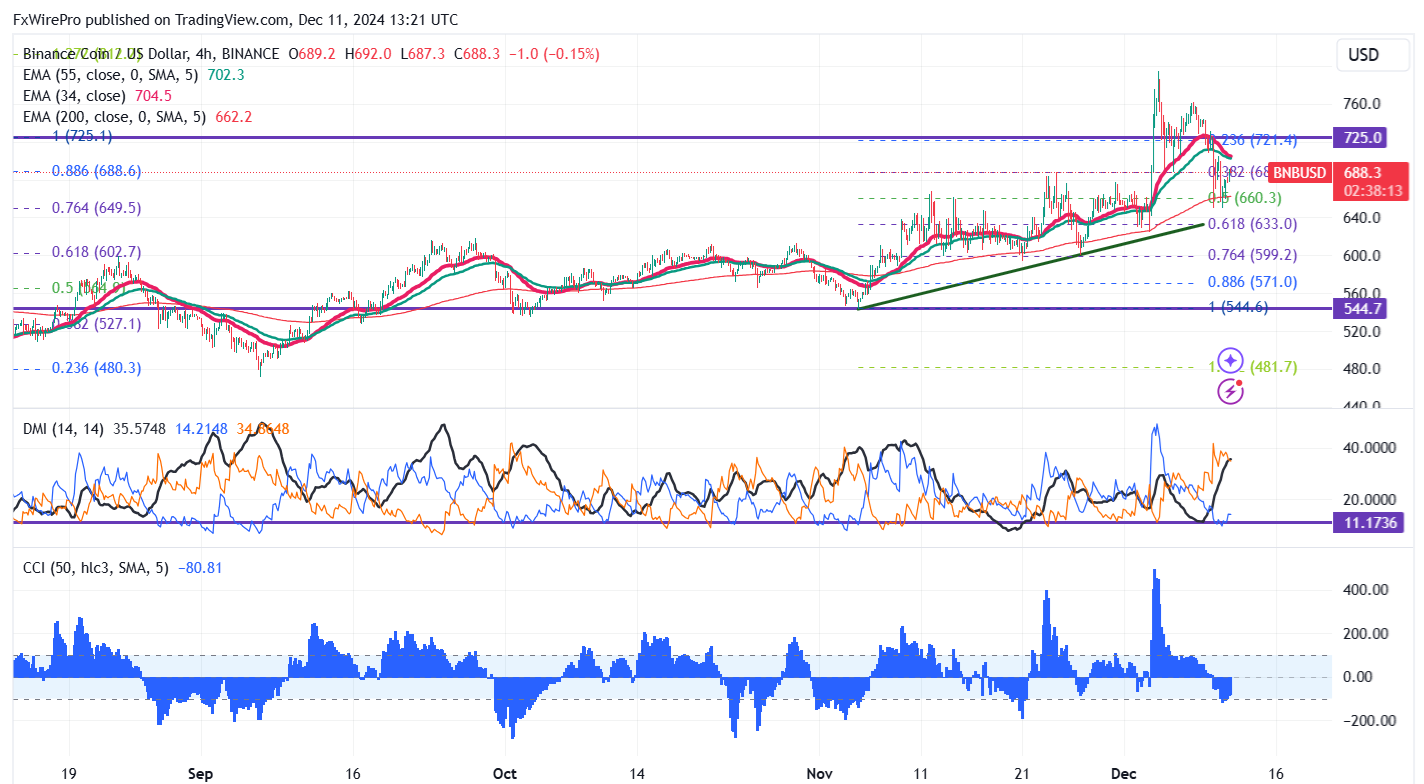
Key Level to Monitor: $640
BNB/USD pair formed a double bottom around $650 and showed a minor pullback. It hit a fresh all-time high $of 793 and is currently trading around $692.
Overall bias remains bullish as long as support of $640 holds. It trades above the 34 and 55 EMA on the 4-hour chart. If the pair closes below $640, potentially leading to further declines towards $580/$550.
Immediate Resistance is at $725. A successful breakout above this resistance could suggest bullish momentum, with further gains possible towards $775/$812/$848/$1000.
Indicators (4-Hour Chart)
- Directional Movement Index: Bullish
- CCI (50): Bullish
Trading Strategy
Consider buying on dips around $650, with a stop-loss set at $600 and a target price of $1000.


