


 Major Crypto Action Bias: ETHUSD Turns Bullish – Only Bullish Pair to Watch
  FxWirePro- Major Crypto levels and bias summary
  Crypto Bias Report: Trend Signals and Top Bullish Picks
  FxWirePro- Major Crypto levels and bias summary
  FxWirePro- Major Crypto levels and bias summary


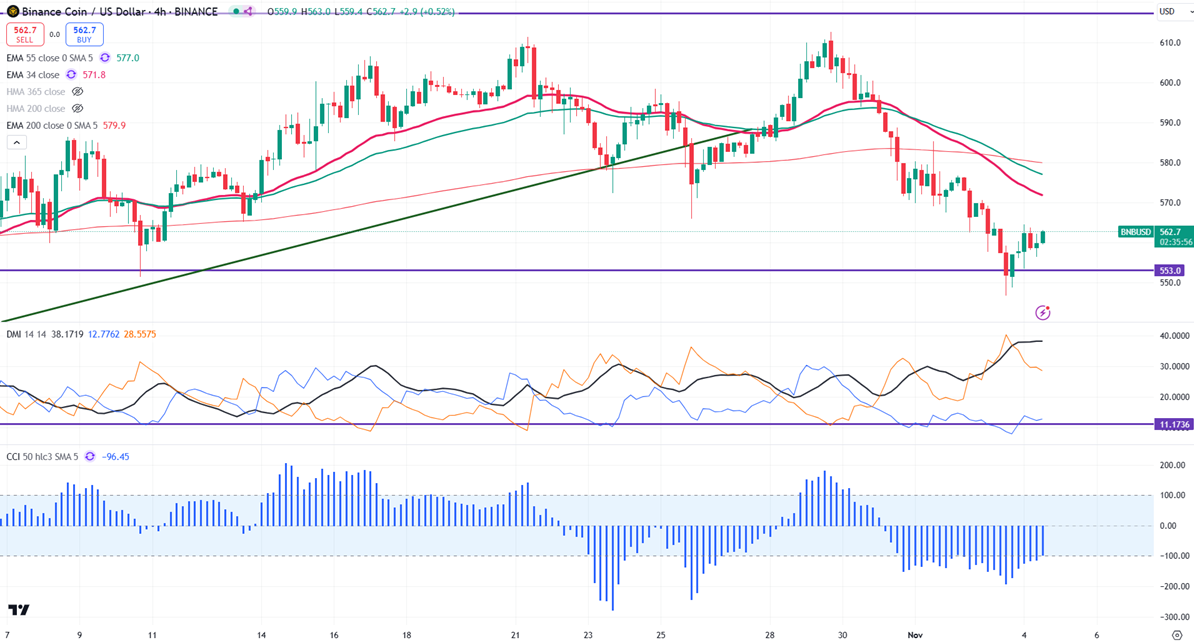
Key Level to Monitor: $545
The BNB/USD pair lost its shine and declined sharply due to profit booking.A closing price below $545 confirms further bearishness.
Currently, BNB/USD has declined by more than 10% and showed a minor pullback, with the momentum now bearish, prices staying below the 34 and 55 EMA on the 4-hour chart. If the pair closes below $545, potentially leads to further declines towards $540, $528, $500, and possibly down to $470.
Immediate Resistance is at $585. A successful breakout above this resistance could suggest bullish momentum, with further gains possible towards $600/$615/$647 or even $700, should it surpass $725.
Indicators (4-Hour Chart)
- Directional Movement Index: Bearish
- CCI (50): Bearish
Trading Strategy
Consider buying on dips around $550, with a stop-loss set at $528 and a target price of $585/$600.


