


 FxWirePro: GBP/AUD bears maintain upper hand
  FxWirePro: AUD/USD rallies on jobs surge, heads to test key resistance
  Crypto Bias Report: Trend Signals and Top Bullish Picks
  AUDJPY Extends Four-Day Rally as Yen Weakness Fuels Fresh Buying Opportunity
  FxWirePro: GBP/AUD downtrend loses steam but outlook still bearish
  Major Crypto Action Bias: BTC, ETH & SOL Turn Bullish – SOLUSD Leads as the Top Pair to Watch
  JPY Strength Alert: USDJPY, AUDJPY, EURJPY and CADJPY Turn Extremely Bullish
  FxWirePro: GBP/USD stays below 1.3400 level following cooler inflation report
  FxWirePro- Major Crypto levels and bias summary
  FxWirePro: USD/CAD retreats slightly but trend is still bullish


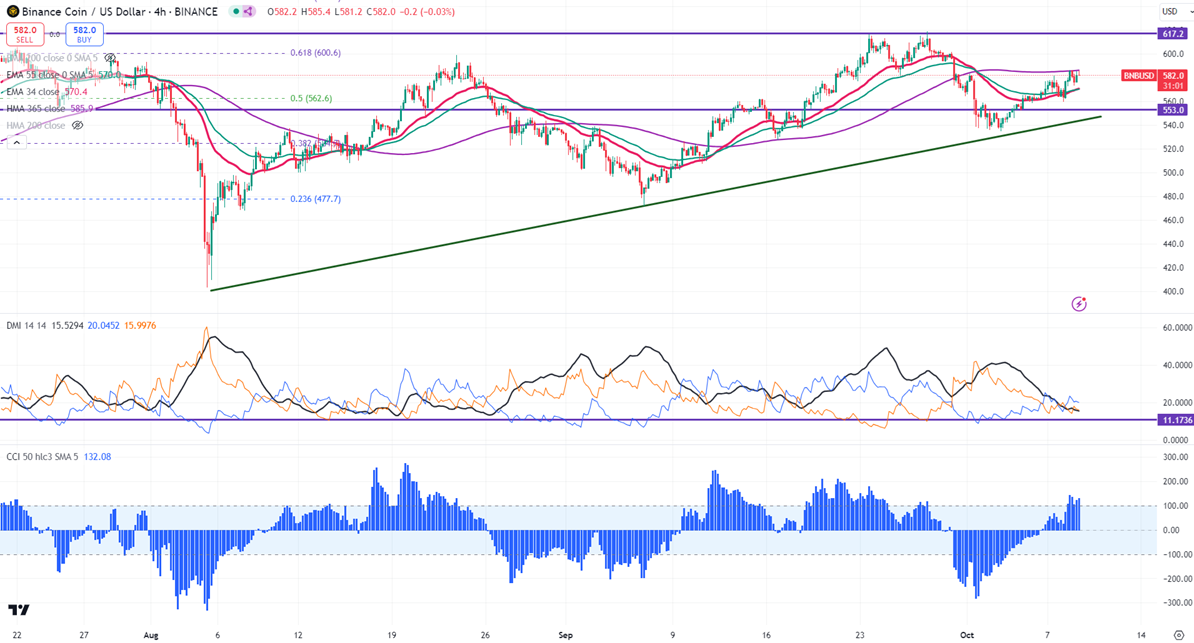
Intraday bias - Bullish
Trend reversal level- $531 (200- day EMA)
Any close above $620 confirms a bullish continuation.
BNBUSD trades flat after a minor pullback. It hits a high of $586.30 at the time of writing and is currently trading around $581.40.
The pair holds above 34 and 55 EMA in the daily chart. Intraday bullishness can be seen if it breaks above 586.90 (365 Hull EMA). The bullish trend continuation can happen if the pair closes above $615 in the daily chart. On the lower side, the near-term support is $560 (resistance turned into support). Any break below targets $540/$528/$500/$470 is possible.
The immediate resistance stands at around $587. Any breach above confirms minor bullishness. A jump to $605/$620/$647/$700 is possible. A surge past $725 will take it to $800.
Indicators ( 4- hour chart)
Directional movement index - Neutral
CCI (50)- Bullish
It is good to buy on dips around $560 with SL around $528 for TP of $700.
a


