


 FxWirePro- Major Pair levels and bias summary
  FxWirePro: USD/ZAR runs out of steam but mains bullish outlook
  FxWirePro: USD/CAD gains on dollar strength and weaker Canadian housing activity
  FxWirePro- Woodies Pivot (Major)
  FxWirePro: GBP/AUD neutral in the near term, scope for further downside
  FxWirePro- Major Crypto levels and bias summary
  FxWirePro: EUR/NZD eases after hot US CPI data
  FxWirePro- Major Crypto levels and bias summary
  FxWirePro: GBP/AUD struggle to extend its recovery, good to sell on rally
  FxWirePro: EUR/NZD steadies 2.0030, retains bid tone


 Add as a preferred source on Google
Intraday bias - Bullish
Horizontal trend line- $605
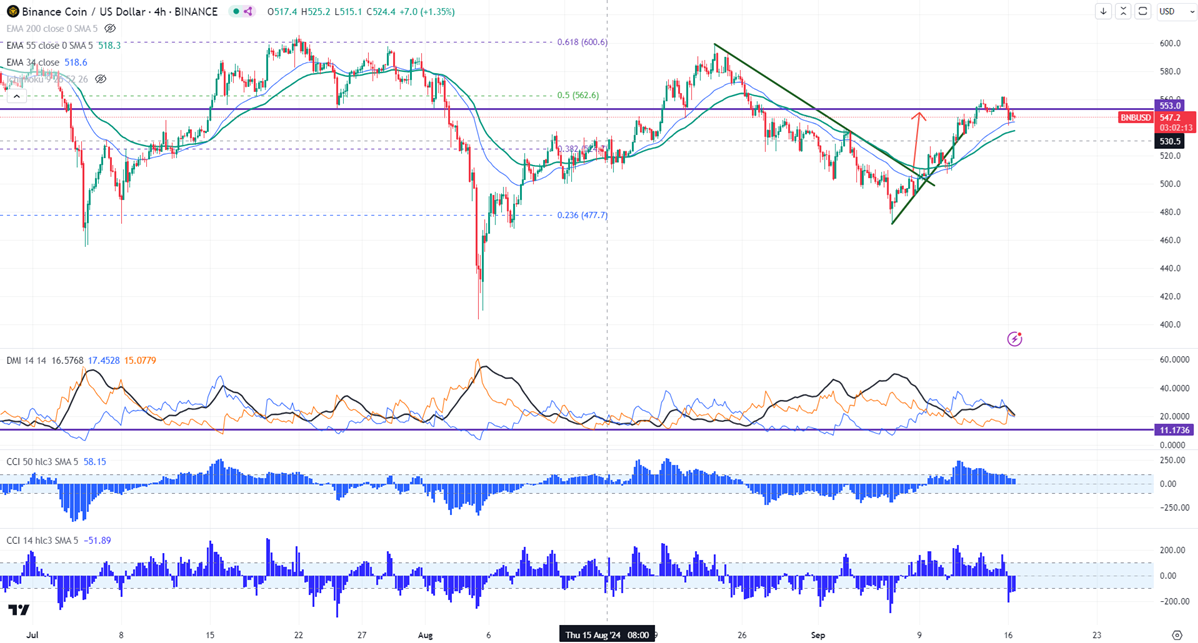
Any close above $562 confirms intraday bullishness.
BNBUSD showed a minor sell-off after hitting a multi-week high. It hit a high of $549.50 and is currently trading around $542.80.
The pair holds above 34 and 55 EMA in the daily chart. The intraday bearish trend continuation can happen if the pair breaks $520. On the lower side, the near-term support is $520. Any break below targets $490/$470/$456 (127.2% fib)/$437 (1.618% fib)/$403 is possible.
The immediate resistance stands at around $562.50 (50% fib). Any breach above confirms minor bullishness. A jump to $569/$605 is possible. Bullish continuation only if it breaks $605. A surge past $605 will take it to $700.
Indicators ( Daily chart)
Directional movement index - Bullish
CCI (50)- Bullish
CCI(14)- Bullish
It is good to buy on dips around $540 with SL around $518 for TP of $605/$700.







