


 Pound on Pause: GBPJPY Bulls Regroup for a Potential Sprint Toward 215.00
  FxWirePro- Major Crypto levels and bias summary
  Bitcoin’s Islamabad Watch: BTCUSD Consolidates Near 71,421 USD as Geopolitical Peace Talks Loom
  FxWirePro: USD/ZAR edges lower ,investors remain on edge
  Ethereum Reclaims Higher Ground: Ether Bulls Target $2,700 as Middle East Tensions Thaw
  FxWirePro: USD/JPY steadies around 158.75, bias bullish
  FxWirePro: GBP/AUD takes back some lost ground
  FxWirePro: GBP/USD bulls remain cautiously optimistic
  FxWirePro- Woodies Pivot(Major)
  Euro Ascendant: EUR/USD Breaks $1.17 as Geopolitical Relief Sparks a Bullish Surge
  Ethereum’s Healthy Correction: Bulls Eye Strategic Re-Entry at 2,150 USD Following Profit-Booking Pullback
  Kiwi Ascendant: NZDJPY Bulls Eye Multi-Year Peaks Amid Triple-Day Rally
  FxWirePro- Major Crypto levels and bias summary
  FxWirePro- Major Pair levels and bias summary
  FxWirePro- Woodies Pivot(Major)


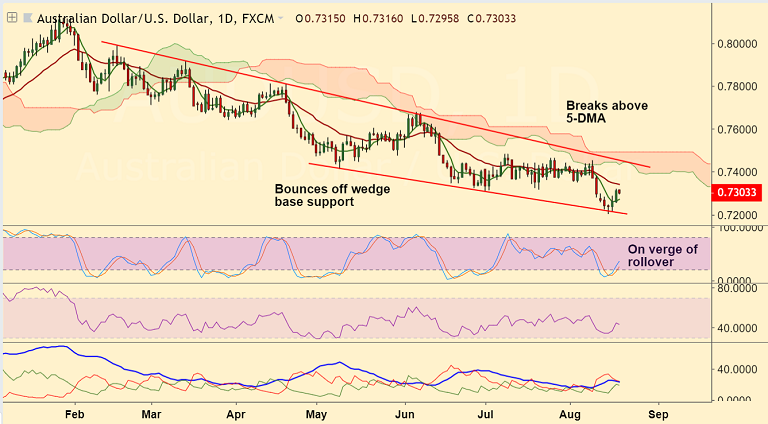
Refer AUD/USD chart on Trading View
- AUD/USD is trading rangebound on the day at 0.7306 at the time of writing.
- The pair is struggling to extend gains above 0.73 handle and finds stiff resistance at 1H 200 SMA at 0.7306.
- Price action has bounced off Wedge base with a 'Dragonfly doji' formation in last week's trade.
- We also see bullish divergence on RSI and Stochs which cloud support further upside.
- Price is extending sideways grind along 1H 200-SMA resistance. Break above could see upside till 21-EMA.
- Price is currently holding above 5-DMA and break below will see test of Wedge base at 0.72. Violation at Wedge base to see resumption of weakness.
- Next major bear target lies at 0.7160 (Dec 2016 lows) ahead of 0.7145 (May 2016 low).
Support levels - 0.7272 (5-DMA), 0.72 (Wedge Base), 0.7160 (Dec 2016 low), 0.7145 (May 2016 low)
Resistance levels - 0.7306 (1H 200-SMA), 0.7342 (21-EMA), 0.74
FxWirePro Currency Strength Index: FxWirePro's Hourly AUD Spot Index was at 67.6226 (Neutral), while Hourly JPY Spot Index was at -25.8952 (Neutral) at 0730 GMT. For more details on FxWirePro's Currency Strength Index, visit http://www.fxwirepro.com/currencyindex.


