


 FxWirePro: GBP/NZD remains weak, eyes 38.2%fib support
  FxWirePro- Woodies pivot (Major)
  US Magnificent 7 Stocks Trend Score: Amazon & Microsoft Hit Extreme Bullish (+100) as Meta Drops to -100 — Key Resistance & Support Watchlist
  FxWirePro: USD/CNY dips to hit three year low,scope for further downside
  NZDJPY Retreats on Yen Strength – Bearish Setup Targets 90 After Hitting 92.75 Low
  AUDJPY Volatile After Massive Sell-Off: Sell Rallies at 113, Targeting 110 as Bearish Momentum Surges
  FxWirePro: GBP/AUD drifts lower after BOE rate decision
  FxWirePro:USD/JPY climbs back above 160.00 after BOJ rate decision
  FxWirePro- Major Crypto levels and bias summary
  FxWirePro: GBP/USD rises as soft US data pressures dollar
  Nikkei Surges Past 65,000 on Suspected Yen Weakness: Tech Giants Like Advantest and NEC Lead Explosive Gains
  AUD/JPY Slips Below 112 as BOJ Intervention Sparks Bearish Momentum: Sell the Rallies
  NZDJPY Bullish Rebound: Buy Dips as EMAs Align for 97 Target
  FxWirePro- Major Pair levels and bias summary
  Major FX Action Bias & US Market Sentiment: NZD/USD (Extremely Bullish) & AUD/USD (Bullish) Watchlist
  FxWirePro: AUD/USD gains some ground but outlook is bearish


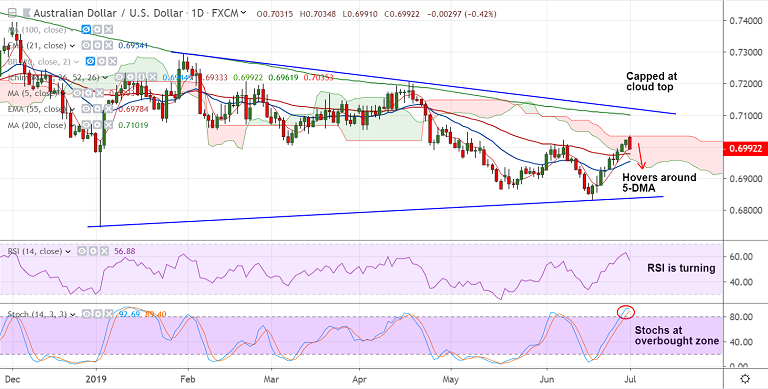
AUD/USD chart - Trading View
AUD/USD slumps lower on the day, trades at 0.6993 at 05:35 GMT, down 0.40% on the day.
Aussie dented after Chinese PMI data misses estimates and mixed headlines on US-China trade truce.
China’s Caixin Manufacturing PMI for June slumped to a five-month low of 49.4 missing forecasts at 50.00.
AUD/USD has paused upside at stiff resistance at 0.7035 (nearly converged cloud top and 110-EMA).
Stochs are at overbought levels and RSI has turned. Volatility is rising on the hourly charts.
Major trend in the pair has been bearish and break below 200H SMA (0.6954) will see downside resumption. Dip till 0.6835 (trendline support) then likely.
Markets eye the Reserve Bank of Australia’s (RBA) monetary policy meeting, scheduled to be held on July 2 at 04:30GMT.
Focus also on U.S. ISM manufacturing data due later today for impetus ahead of the crucial NFP data later this week.
Support levels - 0.6993 (5-DMA), 0.6978 (55-EMA), 0.6954 (converged 21-EMA and 200H SMA),
Resistance levels - 0.7035 (nearly converged cloud top and 110-EMA), 0.7101 (200-DMA), 0.7120 (trendline)
For details on FxWirePro's Currency Strength Index, visit http://www.fxwirepro.com/currencyindex.


