


 GBPJPY Slips After Sterling Weakness, Bears Eye 216
  FxWirePro: EUR/NZD downside pressure builds, key support level in focus
  FxWirePro- Major Pair levels and bias summary
  FxWirePro: USD/CAD positions for another climb, eyes 1.4150 level
  FxWirePro: GBP/AUD downside pressure builds, key support level in focus
  FxWirePro: AUD/USD gains on Iran-US truce hopes, risk rally
  FxWirePro: USD/CNY dips as yuan firms on improving risk appetite
  Major Pairs Action Bias: USDCAD and USDCHF Stand Out as Extremely Bullish While GBPUSD and NZDUSD Turn Extremely Bearish
  FxWirePro: GBP/AUD under pressure as pound continues to weaken
  FxWirePro: NZD/USD gains as U.S.-Iran peace hopes boost risk sentiment
  FxWirePro :USD/JPY eases slightly, remains on bullish path
  FxWirePro: EUR/AUD outlook weaker on renewed downside pressure
  FxWirePro: USD/ZAR uptrend loses steam, remains on bullish path
  FxWirePro: GBP/NZD gains some ground but bias is still bearish
  FxWirePro: NZD/USD edges lower, remains on back foot
  AUDJPY Action Bias: Bullish Dip-Buy Setup Despite Flat Neutral Bias


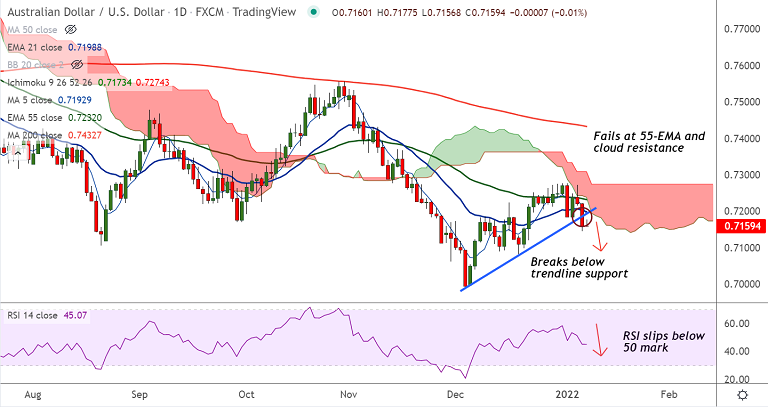
Chart - Courtesy Trading View
Technical Analysis: Bias Bearish
GMMA Indicator
- Major and minor trend are strongly bearish on the daily charts
Ichimoku Analysis
- Price action is extending weakness after rejection at daily cloud
Oscillators
- Stochs and RSI show bearish momentum
- RSI has slipped below 50 mark
Bollinger Bands
- Bollinger bands are spread wide apart and show high volatility
Major Support Levels: 0.71, 0.7091 (Lower BB), 0.7051 (38.2% Fib)
Major Resistance Levels: 0.7172 (200-week MA), 0.7192 (converged 5 and 20 MAs), 0.72
Summary: AUD/USD trades with a bearish bias. The pair has slipped lower from session highs at 0.7177 and is on track for further downside. Scope for test of 38.2% Fib.


