


 FxWirePro- Woodies pivot (Major)
  Pound-Yen Pullback: GBP/JPY Slips Below Key EMAs as Sterling Weakness Fuels Bearish Bet on 210
  Bank of America Posts Strong Q4 2024 Results, Shares Rise
  Peace Dividend Powers NZDJPY Past 93.50 — Bulls Set Sights on 96.15 Target
  Trump’s "Shock and Awe" Agenda: Executive Orders from Day One
  2025 Market Outlook: Key January Events to Watch
  FxWirePro: GBP/AUD steadies around 0.9145 ,retains bid tone
  U.S. Treasury Yields Expected to Decline Amid Cooling Economic Pressures
  NZD/JPY Loses Its Shine: Kiwi Cracks Under Pressure as Bears Target 91.80
  Gold Prices Fall Amid Rate Jitters; Copper Steady as China Stimulus Eyed
  U.S. Banks Report Strong Q4 Profits Amid Investment Banking Surge
  Indonesia Surprises Markets with Interest Rate Cut Amid Currency Pressure
  FxWirePro: USD/CNY hits one –month high, scope for further upside
  U.S. Stocks vs. Bonds: Are Diverging Valuations Signaling a Shift?


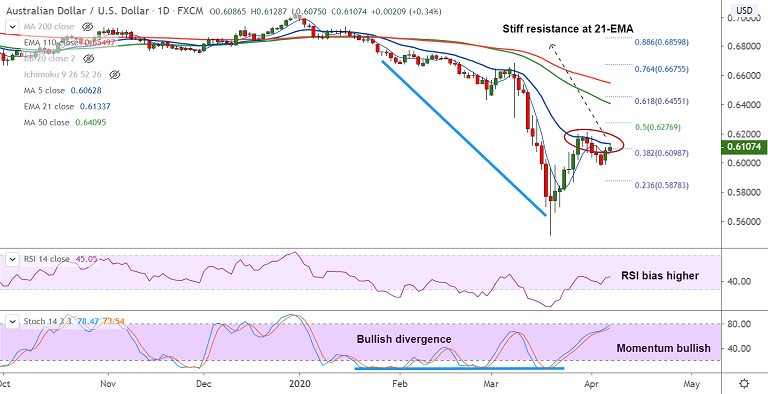
AUD/USD chart - Trading View
AUD/USD was trading 0.42% higher on the day at 0.6112 at around 04:00 GMT, edging lower from session highs at 0.6128.
The pair largely ignored Australian trade numbers and focus remains on the Reserve Bank of Australia (RBA) policy meeting.
February Aussie Trade Balance declined to 4,61M versus 5,210M prior. Details suggest the Exports and Imports have declined -4.0% and -5.0% respectively from -3.0% priors for each.
The RBA (scheduled at 04:30 GMT) is widely expected to stand pat. However, the tone of the monetary policy statement will be the key to determine further price action.
Technical indicators are slightly bullish on the intraday and weekly charts. Bullish divergence could support gains.
21-EMA is strong resistance at 0.6134. Break above could see more upside. Gains till 50% Fin at 0.6269 then likely.
5-DMA is immediate support at 0.6063. Rejection at 21-EMA and retrace below 5-DMA could see downside resumption.
Major Support Levels: 0.6063 (5-DMA), 0.6042 (Tenkan sen), 0.5980 (Apr 3rd low)
Major Resistance Levels: 0.6134 (21-EMA), 0.62, 0.6269 (50% Fib)
Summary: Major trend is bearish, but breakout at 21-EMA could fuel near-term upside. Focus on RBA monetary policy statement for cues.
Guidance: Stay long on breakout at 21-EMA, place stops at 0.6040, target 0.62/ 0.6260


