


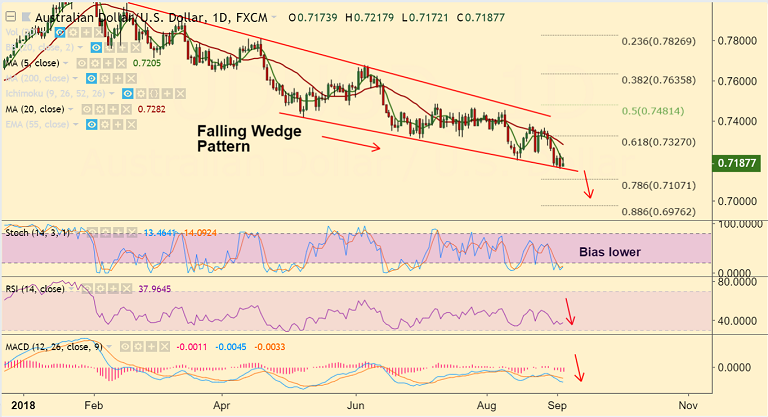
AUD/USD chart on Trading View used for analysis
- AUD/USD has failed to extend upbeat GDP led gains, slips lower from session highs at 0.7217.
- Solid Australian Q2 GDP figures released earlier today boosted the Aussie.
- Australian economy grew at the fastest pace in 6 years. Q2 GDP printed at 0.9% q/q (0.7% expected, 1.0% previous).
- Technically, the major remains on a major downtrend. Trades in a falling Wedge pattern.
- Risk-off sentiment in the emerging markets and commodity space exacerbated the Aussies declines.
- Price action is holding support at Wedge base at 0.7165, break below finds next strong support at 0.7145 (May 2016 low).
- On the flip side, 5-DMA is immediate resistance at 0.7258. Breakout at 50-DMA invalidates bearish bias.
Support levels - 0.7165 (Wedge base), 0.7160 (Dec 2016 low), 0.7145 (May 2016 low), 0.71
Resistance levels - 0.7203 (5-DMA), 0.7284 (21-EMA), 0.7360 (55-EMA)
Recommendation: Watch out for decisive break below Wedge base for further weakness. Target 0.7145/ 0.71.
FxWirePro Currency Strength Index: FxWirePro's Hourly AUD Spot Index was at -69.3171 (Neutral), while Hourly USD Spot Index was at 111.042 (Bullish) at 0615 GMT. For more details on FxWirePro's Currency Strength Index, visit http://www.fxwirepro.com/currencyindex.


