


 FxWirePro- Major Crypto levels and bias summary
  FxWirePro- Woodies pivot (Major)
  FxWirePro- Major Pair levels and bias summary
  FxWirePro- Woodies pivot (Major)
  FxWirePro: USD/ZAR firms ahead of Fed interest rate decision
  FxWirePro: USD/ CNY remains soft ahead of Fed decision
  FxWirePro:EUR/NZD gains some upside momentum but still bearish
  Major Forex Pairs Action Bias: GBPUSD and AUDUSD Turn Extremely Bearish
  JPY Pairs Action Bias: EURJPY Leads as Bullish Standout Amid Mixed Momentum
  FxWirePro: USD/ CNY hits one-month low,scope for futher downside
  FxWirePro : GBP/NZD strongly bearish despite upside attempts
  NZD/JPY Flatlines Near 94.60: Will Key Support Reignite the Uptrend?
  FxWirePro: NZD/USD firms as Kiwi gains on strong ANZ business outlook data
  AUD/JPY Slips Below 112 as BOJ Intervention Sparks Bearish Momentum: Sell the Rallies
  FxWirePro: AUD/USD dips below lower range, bearish bias increases
  NZDJPY Bullish Rebound: Buy Dips as EMAs Align for 97 Target


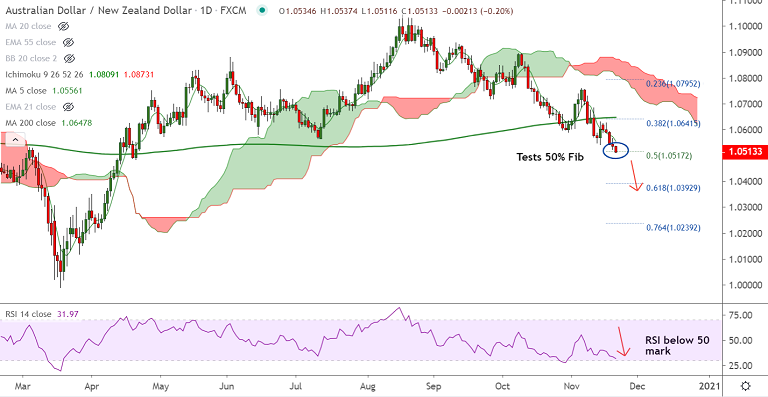
AUD/NZD chart - Trading View
Technical Analysis: Bias Bearish
- AUD/NZD is extending weakness after break below 200-DMA
- Analysis of GMMA indicator shows major and minor trend are strongly bearish on daily and weekly charts
- Volatility is high and rising as evidenced by widening Bollinger bands
- Stochs and RSI are sharply lower, momentum strongly bearish
- Price action is below major moving averages, tested 50% Fib retracement at 1.0517, 61.8% Fib in sight
Support levels - 1.0484 (Apr 21st low), 1.0392 (61.8% Fib), 1.03
Resistance levels - 1.0556 (5-DMA), 1.0589 (200H MA), 1.0622 (21-EMA)
Summary: AUD/NZD trades with a major bearish bias. Scope for test of 61.8% Fib at 1.0392. Bearish invalidation only above 200-DMA.


