


 FxWirePro: EUR/ AUD gains some ground , but remains on bearish path
  EUR/JPY Holds Bullish Bias as Euro Extends Recovery
  FxWirePro: AUD/USD falls after softer-than-expected Australian Q2 CPI
  FxWirePro- Major Pair levels and bias summary
  FxWirePro: USD/JPY eases ahead of Fed decision , Intervention risks linger
  FxWirePro: USD/CAD runs out of steam but maintains bullish outlook
  EURUSD Spikes to 1.14306 on Fed Pause as Traders Eye Sell-the-Rally Setup
  FxWirePro: USD/ZAR firms ahead of Fed interest rate decision
  FxWirePro: USD/ CNY remains soft ahead of Fed decision
  JPY Pairs Action Bias: EURJPY Leads as Bullish Standout Amid Mixed Momentum
  FxWirePro- Major Pair levels and bias summary
  AUDJPY Weakness Deepens: Sell Rallies Toward 112 as Aussie Dollar Falters
  EUR/USD Bounces from Monthly Low, But Bearish Pressure Remains
  FxWirePro: GBP/AUD gains some upside momentum but still bearish
  FxWirePro: GBP/USD edges lower ahead of Fed policy verdict
  FxWirePro: GBP/USD edges higher as traders await BoE guidance and UK fiscal clarity


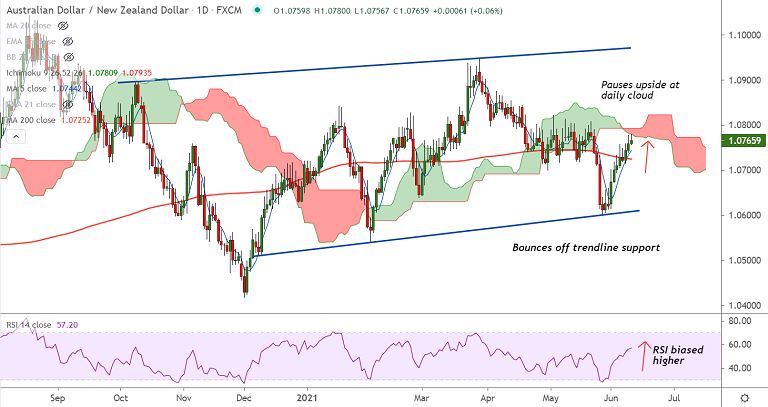
AUD/NZD chart - Trading View
Technical Analysis: Bias Bullish
- AUD/NZD was trading 0.13% higher on the day at 1.0773 at around 10:00 GMT
- The pair is extending 200-DMA breakout and is testing cloud resistance
- Momentum with the bulls, Stochs and RSI are strongly bullish, RSI well above the 50 mark
- MACD shows bullish crossover on signal line, supporting upside in the pair
- Price action has shown a decisive break above 200W MA and weekly cloud
- Volatility is high and rising as evidenced by widening Bollinger bands
Support levels - 1.0742 (55-EMA), 1.0725 (200-DMA), 1.0716 (20-DMA)
Resistance levels - 1.0821 (Previous week high), 1.09, 1.0951 (110-month EMA)
Summary: AUD/NZD trades with a bullish bias. Breakout above cloud will propel the pair higher. Bullish invalidation only below 200-DMA.


