


 Major FX Action Bias & US Market Sentiment: NZD/USD (Extremely Bullish) & AUD/USD (Bullish) Watchlist
  FxWirePro- Major Pair levels and bias summary
  FxWirePro- Woodies pivot (Major)
  Buy the Dips on EUR/JPY: Bullish Structure Points to 188 Target Ahead of Fed
  Major Forex Pairs Action Bias: GBPUSD and AUDUSD Turn Extremely Bearish
  FxWirePro : GBP/NZD strongly bearish despite upside attempts
  AUD/JPY Slips Below 112 as BOJ Intervention Sparks Bearish Momentum: Sell the Rallies
  FxWirePro: USD/CAD slips after Fed holds rates steady
  FxWirePro: NZD/USD neutral in the near-term, scope for downward resumption
  FxWirePro: USD/ZAR firms ahead of Fed interest rate decision
  FxWirePro: GBP/AUD gains some upside momentum but still bearish
  FxWirePro: GBP/USD edges lower ahead of Fed policy verdict
  FxWirePro:EUR/NZD gains some upside momentum but still bearish
  FxWirePro- Major Crypto levels and bias summary
  FxWirePro: NZD/USD firms as Kiwi gains on strong ANZ business outlook data
  FxWirePro: EUR/AUD regains upwards momentum but unable to hold above 50%fib level


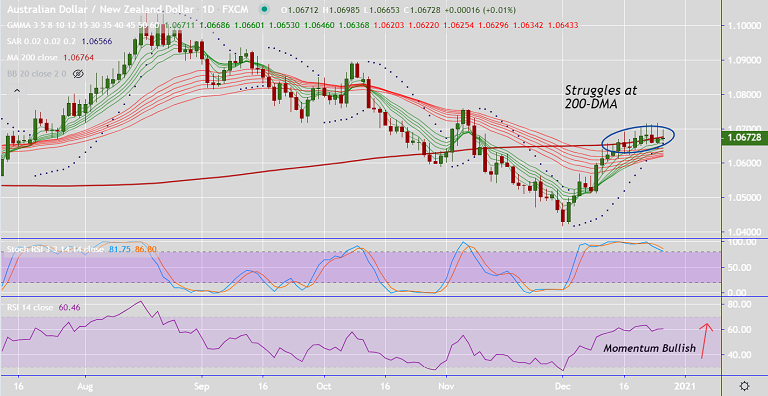
AUD/NZD chart - Trading View
Technical Analysis: Bias Bearish
- AUD/NZD extends sideways grind at 200-DMA resistance
- Momentum studies are bullish, stochs and RSI are biased higher
- Volatility is rising as evidenced by widening Bollinger bands
- Breakout above 200-DMA and into daily cloud supports upside, 50% Fib at 1.0730 in sight
- Failure at 200-DMA will negate further upside. 21-EMA is next strong support at 1.0624
Support levels - 1.0657 (38.2% Fib), 1.0638 (55-EMA), 1.0624 (21-EMA)
Resistance levels - 1.0688 (200W MA), 1.0730 (50% Fib), 1.0759 (Nov 5th high)
Summary: AUD/NZD trades with bullish outlook. Pair is on track to test 50% Fib at 1.0730 ahead of 61.8% Fib at 1.0804. Bullish invalidation on retrace below 200-DMA.


