


 FxWirePro- Major Pair levels and bias summary
  FxWirePro: USD/ZAR retreats but trend is still bullish
  Major Pairs Action Bias: USDCAD and USDCHF Stand Out as Extremely Bullish While GBPUSD and NZDUSD Turn Extremely Bearish
  FxWirePro- Woodies pivot (Major)
  FxWirePro: USD/CAD runs out of steam but maintains bullish outlook
  FxWirePro: EUR/NZD up trend gains momentum but hurdles ahead
  FxWirePro: GBP/NZD maintains bersish bias with focus on 2.2900 level
  FxWirePro: AUD/USD dips after RBA Governor speech
  EUR/USD Bounces from Monthly Low, But Bearish Pressure Remains
  FxWirePro: USD/CAD gaining momentum for a move towards 1.4200 level
  FxWirePro: NZD/USD neutral in the near-term, scope for downward resumption
  EUR/JPY Holds Bullish Bias as Euro Extends Recovery
  AUDJPY Weakness Deepens: Sell Rallies Toward 112 as Aussie Dollar Falters
  NZDJPY Pullback: Sell Rallies Toward 93.30 as Yen Weakness Eases
  JPY Pairs Action Bias: EURJPY Leads as Bullish Standout Amid Mixed Momentum


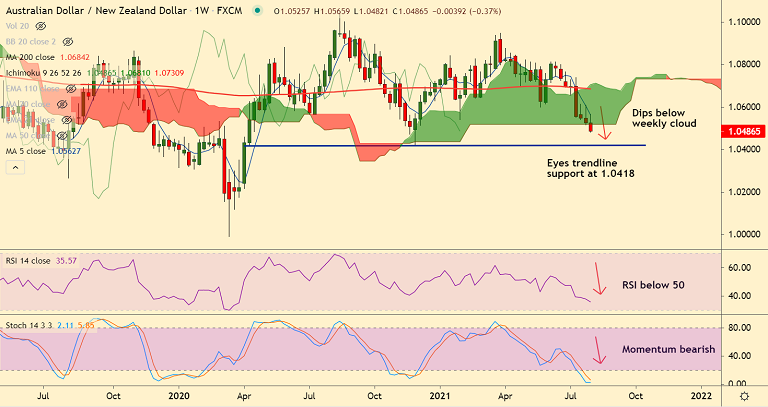
AUD/NZD chart - Trading View
Spot Analysis:
AUD/NZD was trading 0.46% lower on the day at 1.0484 at around 07:25 GMT
Previous Week's High/ Low: 1.0608/ 1.0516
Previous Session's High/ Low: 1.0565/ 1.0525
Fundamental Overview:
Blowout New Zealand jobs data cements RBNZ rate hike later this year, buoys the kiwi across the board.
New Zealand’s jobless rate dropped sharply to 4% in Q2, coming in much better than the 4.5% expected and compared to 4.7% prior.
On the other side, Aussie Retail Sales confirmed -1.8% MoM preliminary figures for July, versus +0.4% prior.
Further, China’s Services PMI for July rose past 50.3 to 54.9, keeping recovery hopes and boosting sentiment.
Challenging the market sentiment were the geopolitical tussles between the Western allies and Iran, as well as China. Escalating covid woes add to the misery.
Additionally, deadlock over US President Joe Biden’s $1.0 trillion infrastructure spending plan keeps traders wary.
Technical Analysis:
- AUD/NZD is extending downside for the 4th straight week
- Momentum is strongly bearish, Stochs and RSI are sharply lower
- Price action has slipped below the weekly cloud
- Volatility is high and rising as evidenced by widening Bollinger bands
Major Support and Resistance Levels:
Support - 1.0420 (Major trendline), Resistance - 1.0527 (5-DMA)
Summary: AUD/NZD trades with a strong bearish bias, further downside on cards. Scope for test of trendline support at 1.0420.


