


 FxWirePro:EUR/NZD gains some upside momentum but still bearish
  Major FX Action Bias & US Market Sentiment: NZD/USD (Extremely Bullish) & AUD/USD (Bullish) Watchlist
  FxWirePro: AUD/USD falls after softer-than-expected Australian Q2 CPI
  FxWirePro: USD/ZAR firms ahead of Fed interest rate decision
  FxWirePro: GBP/USD edges lower ahead of Fed policy verdict
  Major Forex Pairs Action Bias: GBPUSD and AUDUSD Turn Extremely Bearish
  Buy the Dips on EUR/JPY: Bullish Structure Points to 188 Target Ahead of Fed
  FxWirePro: USD/ CNY hits one-month low,scope for futher downside
  JPY Pairs Action Bias: EURJPY Leads as Bullish Standout Amid Mixed Momentum
  FxWirePro: AUD/USD dips below lower range, bearish bias increases
  FxWirePro- Major Pair levels and bias summary
  NZD/JPY Flatlines Near 94.60: Will Key Support Reignite the Uptrend?
  EURUSD Spikes to 1.14306 on Fed Pause as Traders Eye Sell-the-Rally Setup
  FxWirePro- Woodies pivot (Major)
  FxWirePro : GBP/NZD strongly bearish despite upside attempts
  FxWirePro: USD/ CNY remains soft ahead of Fed decision
  AUD/JPY Slips Below 112 as BOJ Intervention Sparks Bearish Momentum: Sell the Rallies


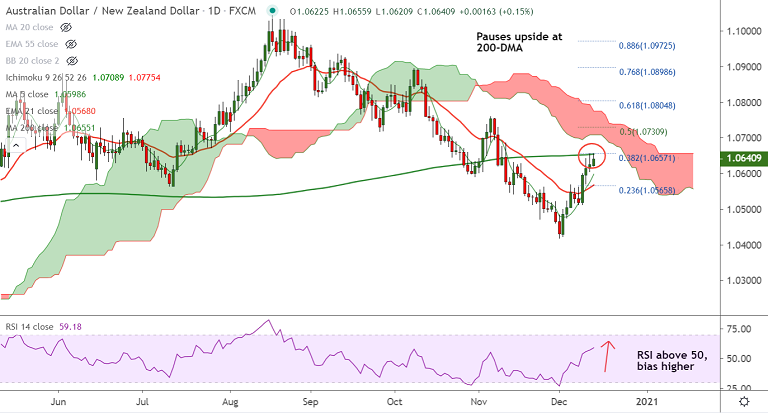
AUD/NZD chart - Trading View
Technical Analysis: Bias Bearish
- AUD/NZD is extending upside for the 3rd straight session
- The pair has bounced off support at weekly cloud
- Volatility is rising as evidenced by widening Bollinger bands
- Analysis of GMMA indicator shows minor trend is strongly bullish
- Momentum studies are strongly bullish, Stochs and RSI are sharply higher
Support levels - 1.0631 (50-DMA), 1.0571 (5W MA), 1.0565 (23.6% Fib)
Resistance levels - 1.0655 (200-DMA), 1.0667 (110-EMA), 1.0730 (50% Fib)
Summary: AUD/NZD has paused upside at 200-DMA at 1.0655. Decisive break above will propel the pair higher. Next major resistance lies at 200W MA at 1.0688 ahead of 50% Fib at 1.0730.


