


 JPY Action Bias: EURJPY and CADJPY Emerge as Extremely Bullish Pairs to Watch
  FxWirePro: USD/ZAR firms ahead of Fed interest rate decision
  Major Forex Pairs Action Bias: GBPUSD and AUDUSD Turn Extremely Bearish
  FxWirePro: USD/CAD slips after Fed holds rates steady
  FxWirePro: AUD/USD dips below lower range, bearish bias increases
  FxWirePro: GBP/USD edges lower ahead of Fed policy verdict
  FxWirePro: USD/ CNY hits one-month low,scope for futher downside
  FxWirePro: USD/JPY eases ahead of Fed decision , Intervention risks linger
  NZDJPY Bullish Rebound: Buy Dips as EMAs Align for 97 Target
  EURUSD Spikes to 1.14306 on Fed Pause as Traders Eye Sell-the-Rally Setup
  FxWirePro: GBP/AUD gains above 1.9200 level , upside pressure builds
  FxWirePro: GBP/NZD maintains bersish bias with focus on 2.2900 level
  FxWirePro: EUR/AUD regains upwards momentum but unable to hold above 50%fib level
  NZD/JPY Flatlines Near 94.60: Will Key Support Reignite the Uptrend?
  Major FX Action Bias & US Market Sentiment: NZD/USD (Extremely Bullish) & AUD/USD (Bullish) Watchlist
  Buy the Dips on EUR/JPY: Bullish Structure Points to 188 Target Ahead of Fed
  FxWirePro: NZD/USD firms as Kiwi gains on strong ANZ business outlook data


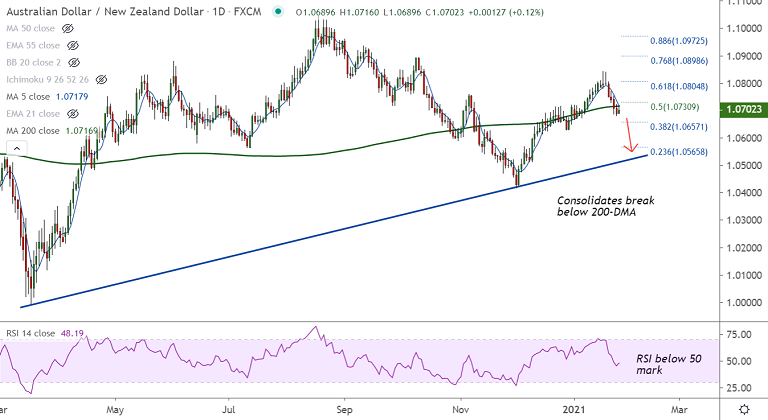
AUD/NZD chart - Trading View
Technical Analysis: Bias Bearish
- Price action consolidating below 200-DMA
- Bearish 5-DMA crossover over 20-DMA adds to the downside bias
- Stochs and RSI are sharply lower, RSI is below 50 mark
- Bearish MACD line crossover on signal line keeps bias lower
- GMMA indicator shows minor trend is bearish and major trend is neutral
Support levels - 1.0687 (nearly converged 200W MA, 55 and 110 EMA), 1.0657 (38.2% Fib), 1.0648 (110W EMA)
Resistance levels - 1.0716 (200-DMA), 1.0734 (20-DMA), 1.0767 (200H MA)
Summary: AUD/NZD is consolidating break below 200-DMA. The pair has paused a 5-day bearish streak after the Australian dollar was buoyed on upbeat Q4 CPI data. Bias is tilted towards the downside. But, retrace above 200-DMA will negate any further bearish bias.


