


 Major Forex Pairs Action Bias: GBPUSD and AUDUSD Turn Extremely Bearish
  NZDJPY Bullish Rebound: Buy Dips as EMAs Align for 97 Target
  Major FX Action Bias & US Market Sentiment: NZD/USD (Extremely Bullish) & AUD/USD (Bullish) Watchlist
  NZD/JPY Flatlines Near 94.60: Will Key Support Reignite the Uptrend?
  FxWirePro: GBP/USD edges lower ahead of Fed policy verdict
  FxWirePro: USD/ CNY hits one-month low,scope for futher downside
  FxWirePro: USD/JPY edges higher as focus shifts to BOJ decision
  FxWirePro: NZD/USD neutral in the near-term, scope for downward resumption
  FxWirePro: GBP/AUD gains some upside momentum but still bearish
  FxWirePro : GBP/NZD strongly bearish despite upside attempts
  AUD/JPY Slips Below 112 as BOJ Intervention Sparks Bearish Momentum: Sell the Rallies
  FxWirePro- Major Crypto levels and bias summary
  FxWirePro: GBP/NZD maintains bersish bias with focus on 2.2900 level
  Buy the Dips on EUR/JPY: Bullish Structure Points to 188 Target Ahead of Fed
  FxWirePro: USD/ZAR firms ahead of Fed interest rate decision
  FxWirePro: EUR/AUD regains upwards momentum but unable to hold above 50%fib level


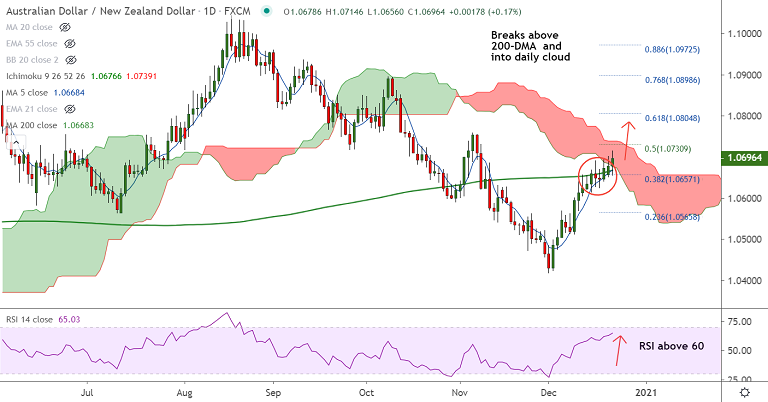
AUD/NZD chart - Trading View
Technical Analysis: Bias Bullish
- Extends gains for the 3rd straight session
- Breaks above 200-DMA and into daily cloud
- Momentum studies are bullish, stochs and RSI are biased higher
- Volatility is rising as evidenced by widening Bollinger bands
Support levels - 1.0668 (200-DMA), 1.0635 (55-EMA), 1.0611 (21-EMA)
Resistance levels - 1.0732 (Upper BB), 1.0759 (Nov 5th high), 1.0804 (61.8% Fib)
Summary: AUD/NZD shows bullish signs, breakout above 200-DMA and into daily cloud supports upside. Scope for test of 61.8% Fib at 0.0804. Bullish invalidation on retrace below 200-DMA.


