


 AI Memory Boom Sparks Global Chip Supply Crunch
  With Iran and the US signing a peace deal, where does that leave Benjamin Netanyahu?
  World Cup technology: from ref cams to AI analysts, cutting-edge research is changing the game
  China’s AI Manufacturing Boom Masks Weak Consumer Economy, Citi Says
  Sell the Bounce": Gold Rally Stalls Near $4165 as Fed Hawks Slam the Door on Rate Cuts — Targets $4000/$3600
  How AI prompting turned writerly description into an everyday skill
  How Donald Trump has changed the way diplomacy is done
  Trump’s Iran Strategy: What Has Been Achieved After Three Months of Conflict?
  Silver Cracks Key 365-Day EMA for First Time Since Feb 2024; Bears Eye $50 on Rallies


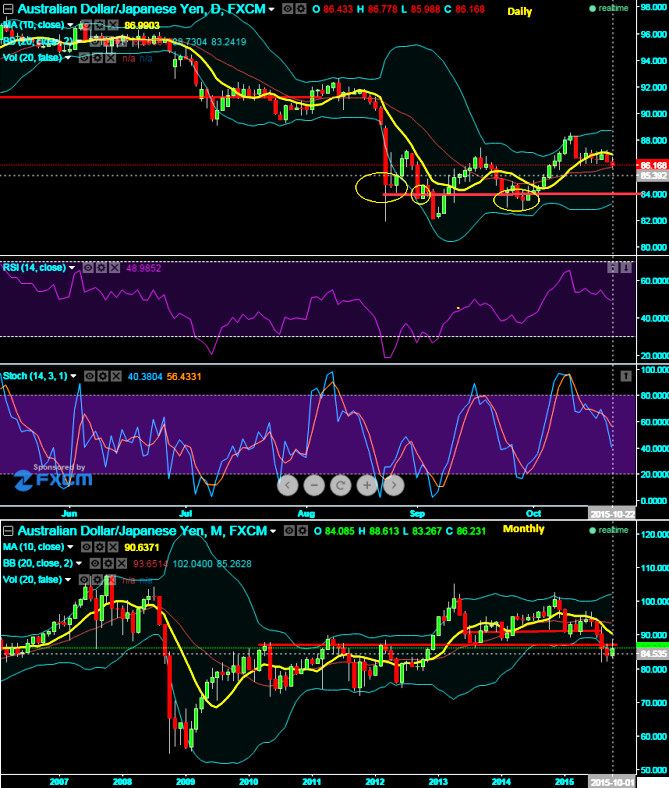
We were bearish on this APAC pair and shared our stance accordingly in our last week's post, you can now figure out from the daily chart that the yellow circled areas served as the strong demand and supply levels for this pair couple of times in the past as well. The next crucial support is only at around 84.576 region on daily chart.
The pair has failed to hold onto the crucial resistance at around 87.069 levels which we already stated earlier that it was unable to breach that level, as a result more weakness is seen in this pair at current level.
EOD graphs suggest bearish signals, the pair has currently fallen below 10DMA and headed towards south.
More importantly, leading oscillators like RSI and slow stochastic curves began showing convergence with the previous downswings; we believe this as bears are getting active. RSI is currently trending at around 48.8238 that has started showing downward convergence to the price dips above 70 levels which is overbought zone.
In addition to that %D crossover on stochastic curve has maintaining above 80 which is signifying again more retracement is likely and it gives us one more reliable indication that the pair is likely to find above mentioned support level.
Thus, as it failed to hold the above stated resistance level, it would determine the next downward direction of trend.

- News

- Economy

- Central Banks
- Investing
- Research
- Roundups
- Digital Currency
- Insights
- Technical Analysis
- Technology
- Business
- Law
- Health
- Nature
- Fintech
- Science
- Topic
- Opinions
- ©Econometrics LLC . All Rights Reserved.
FxWirePro: AUD/JPY likely to slide further, next crucial support at 84.576
Thursday, October 22, 2015 6:34 AM UTC
Editor's Picks


- Market Data
Most Popular


