


 FxWirePro- Major Pair levels and bias summary
  FxWirePro: USD/CAD slips after Fed holds rates steady
  NZD/JPY Flatlines Near 94.60: Will Key Support Reignite the Uptrend?
  FxWirePro- Major Crypto levels and bias summary
  FxWirePro- Woodies pivot (Major)
  AUD/JPY Slips Below 112 as BOJ Intervention Sparks Bearish Momentum: Sell the Rallies
  FxWirePro: AUD/USD dips below lower range, bearish bias increases
  FxWirePro: USD/JPY edges higher as focus shifts to BOJ decision
  FxWirePro- Major Crypto levels and bias summary
  FxWirePro:EUR/NZD gains some upside momentum but still bearish
  JPY Action Bias: EURJPY and CADJPY Emerge as Extremely Bullish Pairs to Watch
  EURUSD Spikes to 1.14306 on Fed Pause as Traders Eye Sell-the-Rally Setup
  NZDJPY Bullish Rebound: Buy Dips as EMAs Align for 97 Target
  FxWirePro: GBP/AUD gains above 1.9200 level , upside pressure builds
  FxWirePro: USD/ZAR firms ahead of Fed interest rate decision
  Major FX Action Bias & US Market Sentiment: NZD/USD (Extremely Bullish) & AUD/USD (Bullish) Watchlist
  FxWirePro- Woodies pivot (Major)


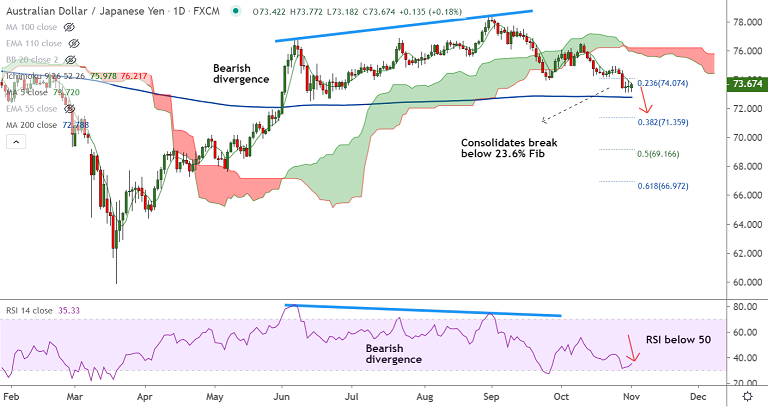
AUD/JPY chart - Trading View
Technical Analysis: Bias Bearish
- GMMA indicator shows major trend is turning bearish while minor trend is strongly bearish
- Price action is below major EMAs and 5-DMA is sharply lower and caps recovery
- Momentum is strongly bearish, MACD and ADX support weakness
- Back-to-back Dojis at lows suggest resistance of bears to drive prices lower.
- Oscillators are at oversold which may cause some upticks, however, pullbacks likely to be shallow
Support levels - 72.78 (200-DMA), 72, 71.35 (38.2% Fib)
Resistance levels - 73.71 (5-DMA), 74.57 (21-EMA), 74.71 (110-EMA)
Summary: AUD/JPY is extending sideways grind above major 200-DMA support, and we see further weakness only on decisive break below. Focus now on RBA policy meet (Tuesday). Markets have priced in a rate cut to a record low of 0.1%. Any dovish surprise in the statement that follows may knock the Aussie lower. Watch out for break below 200-DMA for further downside. Next major support lies at 38.2% Fib at 71.35.


