


 FxWirePro- Major Crypto levels and bias summary
  FxWirePro: AUD/USD dips below lower range, bearish bias increases
  FxWirePro: USD/ZAR firms ahead of Fed interest rate decision
  FxWirePro: EUR/AUD regains upwards momentum but unable to hold above 50%fib level
  Buy the Dips on EUR/JPY: Bullish Structure Points to 188 Target Ahead of Fed
  EURUSD Spikes to 1.14306 on Fed Pause as Traders Eye Sell-the-Rally Setup
  FxWirePro: GBP/USD rises as soft US data pressures dollar
  FxWirePro: USD/JPY edges higher as focus shifts to BOJ decision
  FxWirePro- Major Pair levels and bias summary
  Major Forex Pairs Action Bias: GBPUSD and AUDUSD Turn Extremely Bearish
  FxWirePro- Woodies pivot (Major)
  FxWirePro- Major Crypto levels and bias summary
  NZDJPY Bullish Rebound: Buy Dips as EMAs Align for 97 Target
  AUD/JPY Slips Below 112 as BOJ Intervention Sparks Bearish Momentum: Sell the Rallies
  Major FX Action Bias & US Market Sentiment: NZD/USD (Extremely Bullish) & AUD/USD (Bullish) Watchlist
  FxWirePro : GBP/NZD strongly bearish despite upside attempts


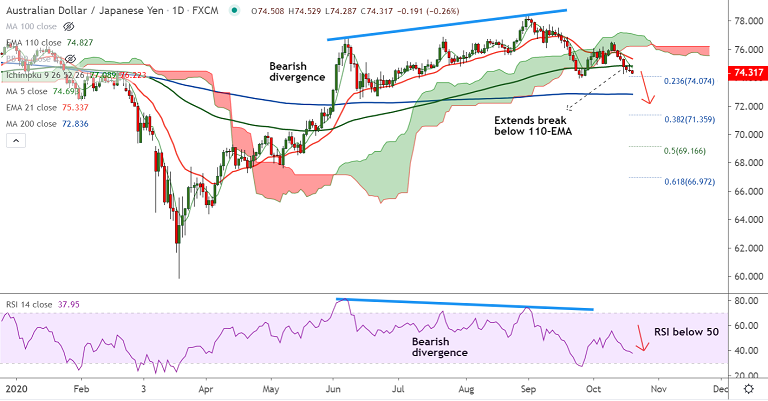
AUD/JPY chart - Trading View
Technical Analysis: Bias Bearish
- The pair extends break below 110-EMA support, down for the 7th straight session
- Price action is below cloud and Chikou span is biased lower suggesting further downside
- Momentum strongly bearish as evidenced by downward sloping Stochs and RSI
- MACD shows bearish crossover on signal line and ADX supports downside
- Volatility is rising as evidenced by widening Bollinger bands
Support levels - 74.07 (23.6% Fib), 73.84 (Lower BB), 72.83 (200-DMA)
Resistance levels - 74.82 (110-EMA), 75.33 (21-EMA), 76.22 (Cloud base)
Summary: Aussie continues to underperform after RBA minutes provided the clearest sign yet that the central bank will likely cut rates further. Technical outlook for the pair is strongly bearish. Scope for dip till 200-DMA at 72.83. Bearish invalidation only above 21-EMA.


