


 Goldman Sachs Raises USD/JPY Forecast, Sees Yen Weakness Persist Through 2027
  Bank of America Upgrades T-Mobile to Buy, Says LEO Satellite Fears Are Overdone
  Smartphones are helping filmmakers tell the stories the movie industry overlooks
  In a rebuke to Trump, the Supreme Court rules that birthright citizenship is the law of the land
  AI can be a personal trainer in your pocket – but is it safe?
  Bernstein Names IAG, Ryanair as Top European Airline Stocks Ahead of Earnings
  Buy the Dip: Gold Holds Strong at $3980, Targets $4150
  Trump has made more than $1 billion from crypto in a year. How?
  Gold Pulls Back After Hitting $4,180 as Geopolitical Risk Sends Crude Higher
  State of emergency in Crimea as Ukraine focuses pressure on ‘jewel in Putin’s crown’
  Alcohol is one of the most dangerous drugs, yet its presence is ubiquitous in social settings and celebrations


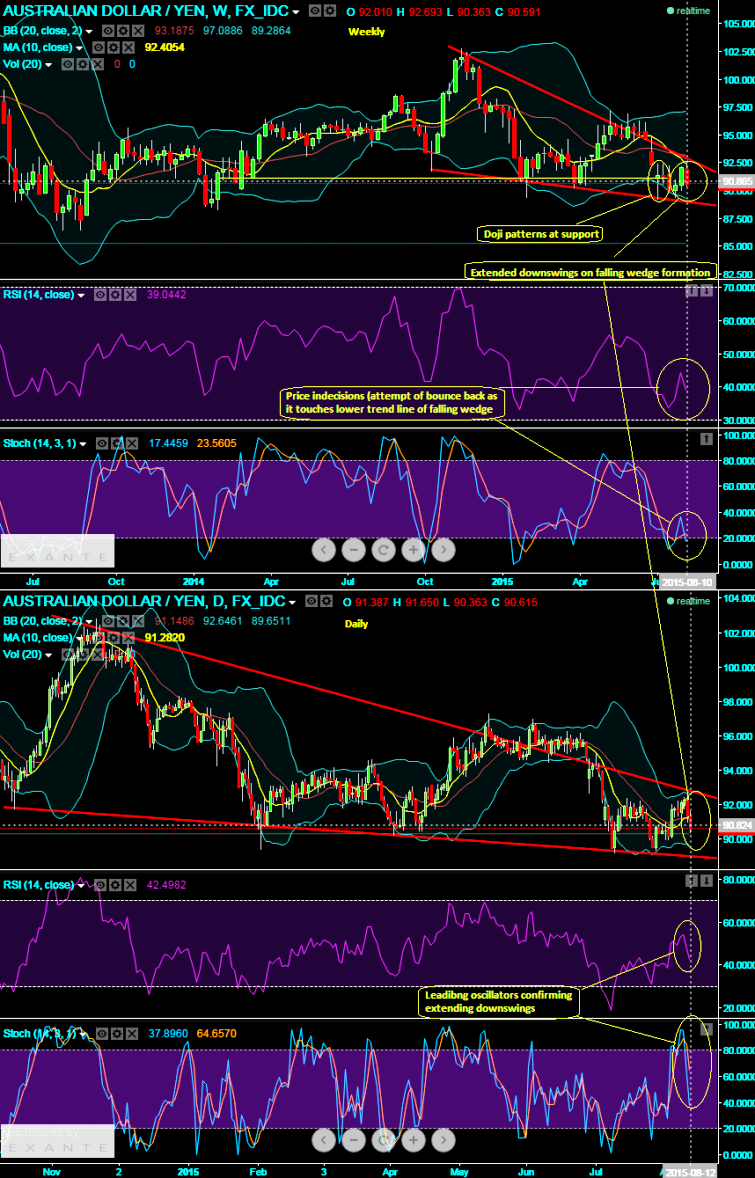
To precisely stating, it is going to be downtrend until it touches 89.347 levels which is at the lower trendline of falling wedge. More précising stating expect downswings in short term trend, bounce back likely in medium term but needs to be confirmed with other indicators.
Both EOD and weekly graphs suggest bearish signals on extended swings in falling wedge formation, Doji patterns formed when the pair was testing a crucial support at around 90.555 levels on weekly charts which means the indication of weakness at that level was intesified.
Leading oscillators like RSI and slow stochastic curves converging downwards according to the price dips on daily charts which is an indication of short term drops on the cards, since it has breached above supports we believe the breach of this level has set the downward direction of next short term trend.
RSI and stochastic on weekly signifies price indecision with daily price fluctuations, so we reckon the short term downtrend which is on falling wedge is temporary until it approaches lower trendline, then at that point of time on subsidiary technical confirmation trend reversal can be adjudged.


