


 FxWirePro:EUR/NZD gains some upside momentum but still bearish
  JPY Action Bias: EURJPY and CADJPY Emerge as Extremely Bullish Pairs to Watch
  Major Forex Pairs Action Bias: GBPUSD and AUDUSD Turn Extremely Bearish
  FxWirePro: USD/ CNY remains soft ahead of Fed decision
  FxWirePro : GBP/NZD strongly bearish despite upside attempts
  EURUSD Spikes to 1.14306 on Fed Pause as Traders Eye Sell-the-Rally Setup
  FxWirePro: GBP/USD edges lower ahead of Fed policy verdict
  FxWirePro: USD/ZAR firms ahead of Fed interest rate decision
  NZD/JPY Flatlines Near 94.60: Will Key Support Reignite the Uptrend?
  FxWirePro: AUD/USD dips below lower range, bearish bias increases
  FxWirePro: AUD/USD falls after softer-than-expected Australian Q2 CPI
  Major FX Action Bias & US Market Sentiment: NZD/USD (Extremely Bullish) & AUD/USD (Bullish) Watchlist
  FxWirePro: GBP/AUD gains some upside momentum but still bearish
  FxWirePro: EUR/AUD regains upwards momentum but unable to hold above 50%fib level
  AUD/JPY Slips Below 112 as BOJ Intervention Sparks Bearish Momentum: Sell the Rallies
  FxWirePro: GBP/AUD gains above 1.9200 level , upside pressure builds
  FxWirePro: NZD/USD firms as Kiwi gains on strong ANZ business outlook data


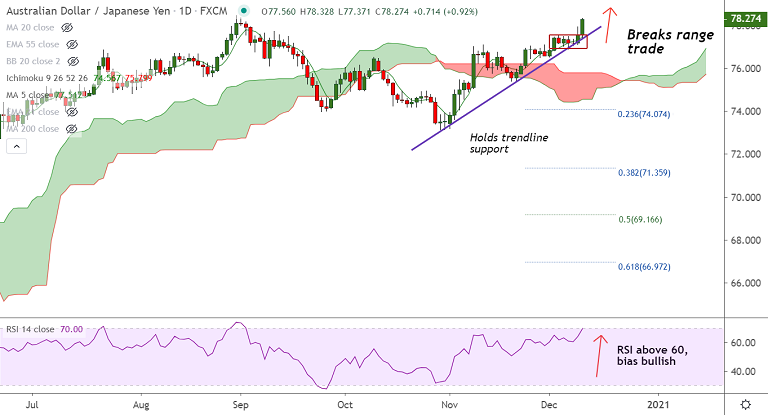
AUD/JPY chart - Trading View
Technical Analysis: Bias Bullish
- Bounces off trendline support at 77.35
- Breaks out of range trade raising scope for further upside
- Momentum strongly bullish, RSI nearing 70 mark with further room to run
- Volatility rising on the daily and weekly charts as evidenced by widening Bollinger bands
- MACD shows bullish crossover on signal line on the weeklies
- GMMA shows major and minor trend are strongly bullish on the daily charts
Support levels - 77.50 (5-DMA), 76.78 (21-EMA), 76.10 (55-EMA)
Resistance levels - 78.46 (2020 high), 79.23 (200W MA), 80.71 (2019 high)
Summary: AUD/JPY pair trades with a strong bullish bias. The Australian dollar picked up bids after Consumer Inflation Expectations data and as AU yields turn negative for the first time. Scope for test of 200W MA at 79.23. Bullish invalidation below 77 mark.


