


 Gold Prices Fall Amid Rate Jitters; Copper Steady as China Stimulus Eyed
  Lithium Market Poised for Recovery Amid Supply Cuts and Rising Demand
  Peace Dividend Powers NZDJPY Past 93.50 — Bulls Set Sights on 96.15 Target
  Pound-Yen Pullback: GBP/JPY Slips Below Key EMAs as Sterling Weakness Fuels Bearish Bet on 210
  FxWirePro: NZD/USD jumps after US and Iran agree preliminary deal
  S&P 500 Relies on Tech for Growth in Q4 2024, Says Barclays
  Moldova Criticizes Russia Amid Transdniestria Energy Crisis
  US Futures Rise as Investors Eye Earnings, Inflation Data, and Wildfire Impacts
  Indonesia Surprises Markets with Interest Rate Cut Amid Currency Pressure
  FxWirePro: USD/CNY hits one –month high, scope for further upside
  China's Refining Industry Faces Major Shakeup Amid Challenges
  Geopolitical Shocks That Could Reshape Financial Markets in 2025
  FxWirePro: AUD/USD eases after Australian mixed CPI data
  Mexico's Undervalued Equity Market Offers Long-Term Investment Potential
  FxWirePro: USD/CAD steadies around 1.3990 ,retains bid one


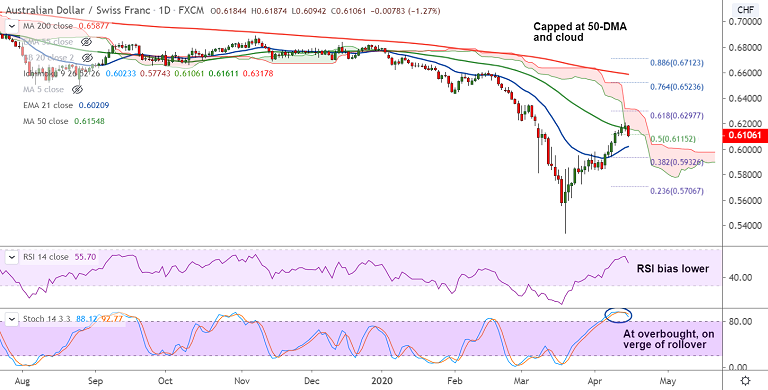
AUD/CHF chart - Trading View
AUD/CHF was trading 1.22% lower on the day at 0.6110 at around 11:25 GMT after 'Spinning Top' formation on the previous day's candle.
After gaining over 16% from 2020 lows at 0.5341, the pair is showing signs of minor correction.
Stiff resistance is seen at 50-DMA and daily cloud. Technical studies show oscillators are at overbought levels.
GMMA shows shift in major and minor trend on the hourly charts. Daily charts show neutral trend.
RSI has turned and Stochastics are on verge of rollover from overbought levels.
The pair finds strong support at 200H MA at 0.6050. Break below will confirm further weakness.
Next immediate support lies at 21-EMA at 0.6021 ahead of 38.2% Fib at 0.5932 and 20-DMA at 0.5929.
On the flipside, decisive break above 55-EMA required for upside continuation.


