


 AUDJPY Breaks Key Trendline Support — Bears Eye 110 as Momentum Accelerates
  U.S. Banks Report Strong Q4 Profits Amid Investment Banking Surge
  China’s Growth Faces Structural Challenges Amid Doubts Over Data
  FxWirePro- Woodies pivot (Major)
  S&P 500 Relies on Tech for Growth in Q4 2024, Says Barclays
  Gold Prices Fall Amid Rate Jitters; Copper Steady as China Stimulus Eyed
  UBS Predicts Potential Fed Rate Cut Amid Strong US Economic Data
  Bitcoin Sheds $491M in ETF Outflows and Retreats Below $64K; Sellers Reload for $50K
  US Gas Market Poised for Supercycle: Bernstein Analysts
  Bank of America Posts Strong Q4 2024 Results, Shares Rise
  Moldova Criticizes Russia Amid Transdniestria Energy Crisis
  FxWirePro- Major Crypto levels and bias summary
  FxWirePro: USD/CAD hits 14-month high , Scope for further upside
  Moody's Upgrades Argentina's Credit Rating Amid Economic Reforms
  FxWirePro: AUD/USD drifts lower, uninspired by jobs beat
  FxWirePro: EUR/AUD bullish outlook with scope to target 1.6550
  FxWirePro: USD/CNY hits one –month high, scope for further upside


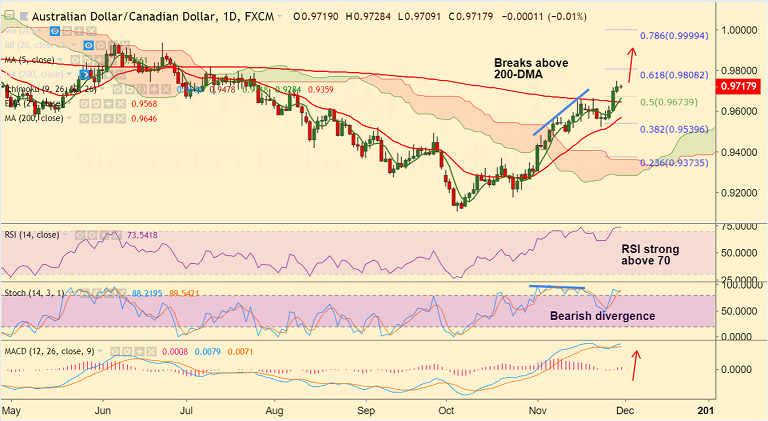
AUD/CAD chart on Trading View used for analysis
- AUD/CAD trades rangebound on the day, markets await Canada GDP data.
- Price action is pausing upside after 5 consecutive sessions of gains.
- Technical indicators support further gains. Stochs and RSI are biased higher, momentum bullish.
- The pair is in a near-term bull trend and breakout at 200-DMA has raised scope for further upside.
- That said, we evidence a bearish divergence on Stochs which dents scope for upside.
- Bias higher as long as 200-DMA support holds. Next major resistance lies at 61.8% Fib at 0.98.
- On the flipside, retrace below 200-DMA could see test of 21-EMA. Violation there to see bullish invalidation.
Support levels - 0.9661 (5-DMA), 0.9646 (200-DMA), 0.9568 (21-EMA)
Resistance levels - 0.9748 (Nov 28 high), 0.9808 (61.8% Fib), 1.00 (78.6% Fib)
For details on FxWirePro's Currency Strength Index, visit http://www.fxwirepro.com/currencyindex.


