


 Goldman Sachs Flags 3 Key Risks Ahead of Europe’s Earnings Season
  FxWirePro: USD/CAD dips contained, bias still leans higher
  FxWirePro: USD/ZAR edges higher as South African rand softens after foreign reserves fall
  FxWirePro- Major Pair levels and bias summary
  EURUSD Pulls Back: Buy Dips as Bulls Target 1.1525
  Buy the Dip: Gold Holds Strong at $3980, Targets $4150
  EURUSD Weakens as US-Iran Ceasefire Collapses – Sell Rallies?
  FxWirePro: NZD/USD drifts lower as RBNZ policy decision looms
  State of emergency in Crimea as Ukraine focuses pressure on ‘jewel in Putin’s crown’
  USA at 250: the Black American struggle for life, liberty and the pursuit of happiness
  Goldman Sachs Raises USD/JPY Forecast, Sees Yen Weakness Persist Through 2027
  FxWirePro- Major Crypto levels and bias summary
  Gold Shakes Off Profit Booking: Buy Dips as Bulls Target $4400
  Vietnam’s population hit the 100 million milestone. Where’s it headed?


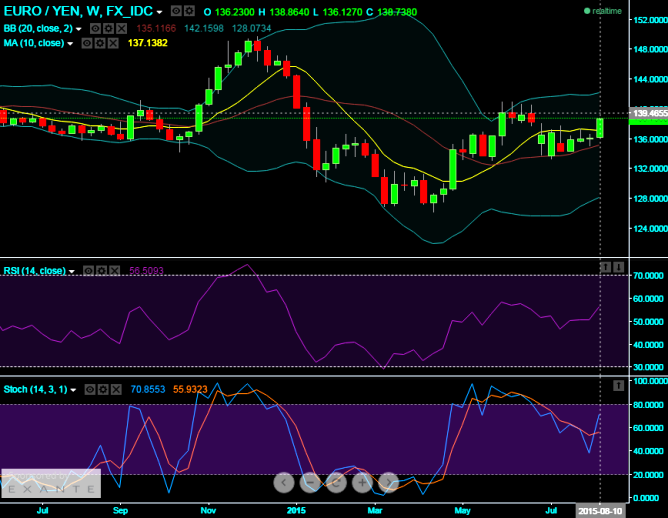
Technical Glance:
Although the formation of bearish pattern candles such as Doji's on weekly and sharp shooting star & spinning top on daily charts. This was boosted up by downward convergence by weekly RSI and overbought signal by stochastic, but bulls were not ready to give up upward momentum that had started from last couple of months (from mid April), we had mentioned this earlier also, as a result the pair is rising in an attempt of snatching the rallies.
Currently, RSI (14) trending near 56.4735 levels which is converging rising prices on both daily and weekly charts.
Although the there is no trace of either overbought or oversold situation from stochastic, it alarms bulls have taken over the rallies as the slow stochastic noises with %K line cross over around 60 levels (current %K line flashes at 70.6541).
But 10 DMA is averaged the prices which would justify prevailing sideway trend as there were a slight attempts of gaining momentum on either side. But on daily charts it has been a bit bullish signal.
So with all positive signs from leading oscillators we reckon the pair may most likely to test resistance at 139.4655 levels.

- News

- Economy

- Central Banks
- Investing
- Research
- Roundups
- Digital Currency
- Insights
- Technical Analysis
- Technology
- Business
- Law
- Health
- Nature
- Fintech
- Science
- Topic
- Opinions
- ©Econometrics LLC . All Rights Reserved.
FxWirePro: €/¥ holds support at 135.0252; targeting 139.4655 as leading oscillators signal bullish trend
Friday, August 14, 2015 6:35 AM UTC
Editor's Picks


- Market Data
Most Popular


