


 Best Gold Stocks to Buy Now: AABB, GOLD, GDX
  Gold Prices Fall Amid Rate Jitters; Copper Steady as China Stimulus Eyed


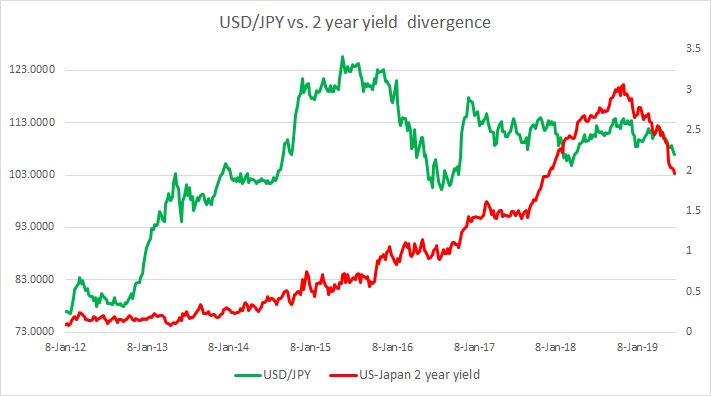
The above chart shows the relation between the 2-year bond spread (U.S. - Japan) and USD/JPY exchange rate.
Brief background (2012-2016):
This one pair has been at odds with yield divergence throughout early 2016 as the yen benefited from risk aversion and due to market participants’ doubts on BoJ’s abilities to ease policies further.
- It had shown excellent response to the yield divergence in the past, especially after the Bank of Japan (BoJ) announced its quantitative easing program back in 2012. The close relationship lasted until the summer of 2015. US-Japan 2 year yield spread rose from 0.13 percent in 2012 to 0.72 percent by May 2015 and hovered there till October and the exchange rate reached from 76 to 126 in that same period.
- However, trouble started surfacing after summer. We guess it was triggered by surprise devaluation of the yuan by the Chinese central bank, People’s Bank of China (PBoC).
- The yield spread kept rising in favor of the dollar. The yield spread rose more than 30 basis point since summer, but, the yen has strengthened from 126 to as low as 98.
- After Donald Trump, the Republican candidate secured a victory in 2016’s US election the exchange rate started to respond to the yield difference once more. After Mr. Trump’s victory, the yield gap jumped suddenly by more than 25 basis points and the yen weakened to 114 per dollar from as high as 101 per dollar.
Yield spread (2016-19)
- The yield spread widened from 145 bps in August 2016 to more than 300 bps in December 2018. The USD/JPY, also responding nicely to the widening spread, rose from 109.5 area to 114.
- Since December, the spread is in decline.
- As of today, the spread has declined to 196 bps and the USD/JPY has declined to 107 area.


