


 FxWirePro: Daily Commodity Tracker - 21st March, 2022


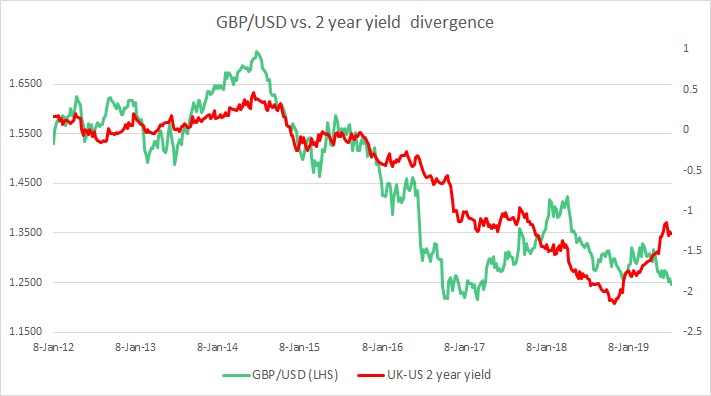
The chart above shows, how the relationship between GBP/USD and 2-year yield divergence has unfolded since 2012.
- The chart clearly shows the close relationship between the yield spread and the exchange rate. Since June 2014, the yield spread declined from 0.5 percent area to -2.15 percent area by November 2018, and GBP/USD declined from 1.71 to 1.25 area.
- In our December review, we noted that since the second week of November, the yield spread has reversed course, and rose from -2.15 percent to -1.9 percent, which suggested there might be a reversal in the exchange rate going ahead, should the spread continue its reversal.
- As expected, the exchange rate has reversed course.
- Although Brexit updates are causing major moves in GBP/USD, the chart clearly shows that yield spread remains a crucial underlying influencing factor.
- In March, the spread has further narrowed to -1.69 percent, while GBP/USD has strengthened to 1.326.
- In April, the spread has further narrowed to -159 bps in favor of the pound but GBP/USD exchange rate has declined to 1.308, amid Brexit uncertainty. The narrowing of spread raises the possibility of a further rise in GBP/USD.
- In May, the spread further narrowed to -155 bps in favor of the pound, while GBP/USD moved lower. Currently trading at 1.301 area.
- In June, the spread further narrowed to -118 bps, but GBP/USD has declined to 1.269 area.
- Since June, the spread has actually reversed course as the Bank of England (BoE) signaled possible policy easing. The spread has again widened to -128 bps as of July, and GBP/USD has declined further to 1.246 as of today against the USD.


