


 Smartphones are helping filmmakers tell the stories the movie industry overlooks
  Goldman AM Sees Strong Buyout Opportunities in Japan, South Korea and Australia
  Gold Surges Past $4150 on Dovish Fed Signals and Weak Jobs Data; Bullish Outlook Prevails
  Bank of America Upgrades T-Mobile to Buy, Says LEO Satellite Fears Are Overdone
  Goldman Sachs Raises USD/JPY Forecast, Sees Yen Weakness Persist Through 2027
  USA at 250: the Black American struggle for life, liberty and the pursuit of happiness
  Alcohol is one of the most dangerous drugs, yet its presence is ubiquitous in social settings and celebrations
  In a rebuke to Trump, the Supreme Court rules that birthright citizenship is the law of the land
  Goldman Sachs Says China Competition Weighs More on EU Growth Than Trade Deficit


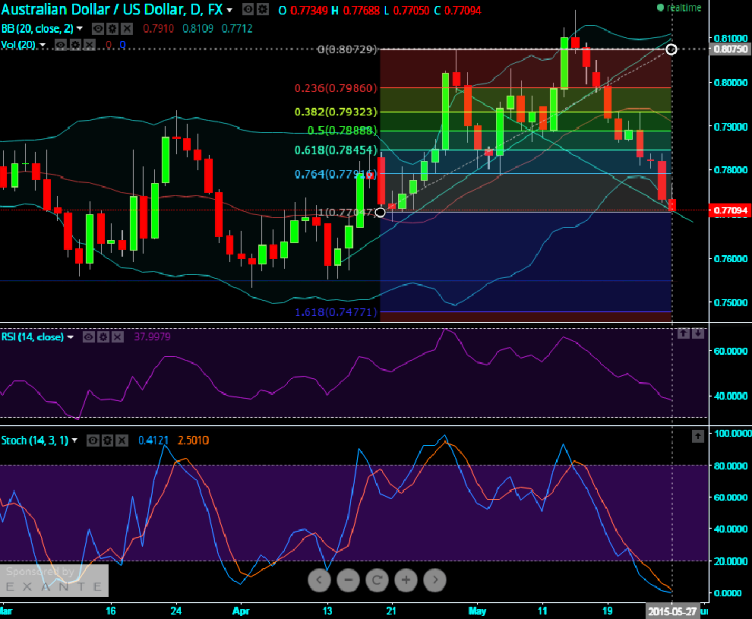
Technical insights: (AUD/USD)
No wonder.. why has this pair been slumping.
On a daily chart of AUD/USD it is figured out that almost 80% of retracement on a short term all the way from peaks of this pair at around 0.81 levels.
Inverse trend line signaling the direction towards Fibonacci points at 0.236 levels which means no trace of recovery on this pair as it is trading near %D line on stochastic. (0.236)*(0.7985) = approximately another 0.18 points from current juncture.
However, we suspect the other oscillators except RSI show early signs of recovery. But long term traders are advised to tolerantly wait for better clarity for upside swings.
Risky swing traders can enhance the returns if they catch early reversal points.
Bollinger band:
Upper = 0.8109
Lower = 0.7712
Stochastic:
%K line = 0.1517
%D line = 2.3275
RSI (14) = 37.8693

- News

- Economy

- Central Banks
- Investing
- Research
- Roundups
- Digital Currency
- Insights
- Technical Analysis
- Technology
- Business
- Law
- Health
- Nature
- Fintech
- Science
- Topic
- Opinions
- ©Econometrics LLC . All Rights Reserved.
Fibonacci retracements indicate AUD/USD still overpriced
Wednesday, May 27, 2015 12:54 PM UTC
Editor's Picks



- Market Data
Most Popular




