


 Trump has made more than $1 billion from crypto in a year. How?
  Bank of America Upgrades T-Mobile to Buy, Says LEO Satellite Fears Are Overdone
  Alcohol is one of the most dangerous drugs, yet its presence is ubiquitous in social settings and celebrations
  AI can be a personal trainer in your pocket – but is it safe?
  Michael Burry Shorts Tesla at $416 as AI and Semiconductor Bearish Bets Expand
  Citi Raises TSMC Price Target as AI Chip Demand Strengthens Growth Outlook
  Buy the Dip: Gold Holds Strong at $3980, Targets $4150
  Elon Musk is remaking the world, like Henry Ford before him – but more dangerously
  JPMorgan Cuts Gold Price Forecast, Sees Bullion Reaching $4,500 by End of 2026
  State of emergency in Crimea as Ukraine focuses pressure on ‘jewel in Putin’s crown’
  Gold Surges Past $4150 on Dovish Fed Signals and Weak Jobs Data; Bullish Outlook Prevails


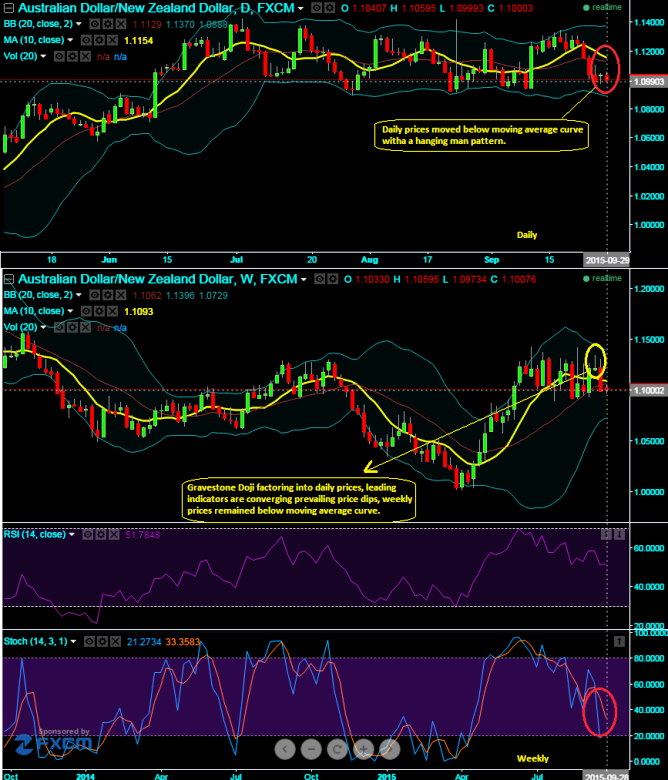
We maintain our bearish stance on this pair as the prices both on weekly and daily patterns have been well below moving average curve that signals us long term bearish trend is on the cards.
The pair has pretty much achieved our earlier target at 1.1317, we could now foresee and maintain our next target for this pair is at 1.0937 levels towards south.
RSI is currently trending near 44.5079, while %D crossover on slow stochastic above 70 levels signifies bearish momentum is continuing. Last month's diagonal strips have taken care of upswings and downswings and yielded handsome returns and we are firm onto continue with the same.
We traced out bearish gravestone doji pattern around 1.1218 levels on weekly charts in earlier post, and leading oscillators to substantiate current price fluctuations. Now the rest all is history and the current prices have shown their impact of this bearish candle pattern.

- News

- Economy

- Central Banks
- Investing
- Research
- Roundups
- Digital Currency
- Insights
- Technical Analysis
- Technology
- Business
- Law
- Health
- Nature
- Fintech
- Science
- Topic
- Opinions
- ©Econometrics LLC . All Rights Reserved.
FXWirePro: AUD/NZD extensive downswings most likely on a signal by lagging indicator after gravestone doji formation
Tuesday, September 29, 2015 7:47 AM UTC
Editor's Picks


- Market Data
Most Popular


