


 FxWirePro- Major Crypto levels and bias summary
  FxWirePro- Major Crypto levels and bias summary


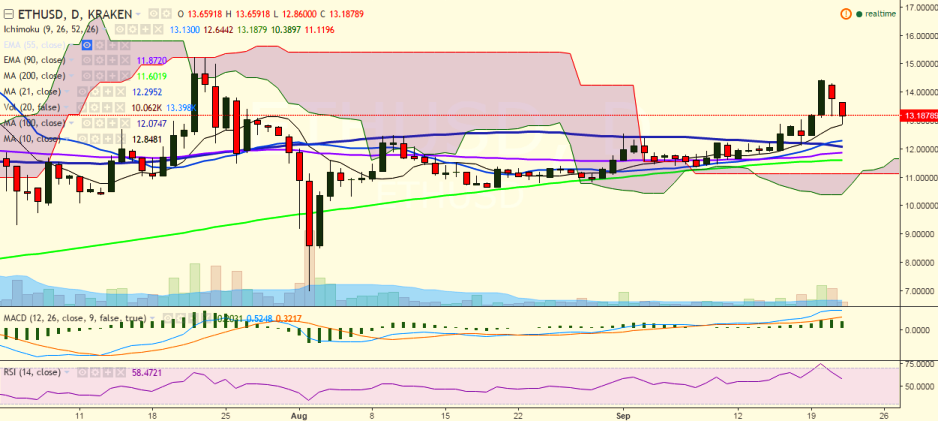
ETH/USD moved further south on Thursday and seems to have taken support near 10-day MA. It is currently trading at 13.21 levels (Kraken).
Long-term trend: Bullish
Ichimoku analysis of daily chart:
Tenkan Sen: 13.13
Kijun Sen: 12.64
Trend reversal: 11.84 (90 EMA)
“ETH/USD has failed to break above 15.00 levels and declined sharply. It has hit a fresh low of 12.86 levels so far in the day before restoring to 13.21 levels. It is currently trading above both Tenkan Sen and Kijun Sen, which suggests that a small jump till 13.84 (61.8% retracement of 14.45 and 12.86) is possible”, FxWirePro said in a statement.
On the top side, the pair faces immediate resistance at 14.45 (September 20 high) and a break above would target 15.23 levels (July 22 high)/16.08 (June 22 high).
On the reverse side, support is likely to be found at 12.72 (10 DMA) and a break below would drag the pair to 12.13 (100 DMA)/11.79 (90 EMA).

- News

- Economy

- Central Banks
- Investing
- Research
- Roundups
- Digital Currency
- Insights
- Technical Analysis
- Technology
- Business
- Law
- Health
- Nature
- Fintech
- Science
- Topic
- Opinions
- ©Econometrics LLC . All Rights Reserved.
ETH/USD takes support at 10-DMA, slight jump till 13.80 likely
Thursday, September 22, 2016 10:59 AM UTC
Editor's Picks


- Market Data
Most Popular


