


 FxWirePro- Major Crypto levels and bias summary
  FxWirePro- Major Crypto levels and bias summary
  FxWirePro- Major Crypto levels and bias summary
  FxWirePro- Major Crypto levels and bias summary
  Ethereum Cracks Under $1,700: Sell the Rally Near $1,750 as Bears Eye $1,380–$1,200
  BTC’s Bear Bounce: Sell the Rally Near $66K as Bears Target $59K–$52K Breakdown


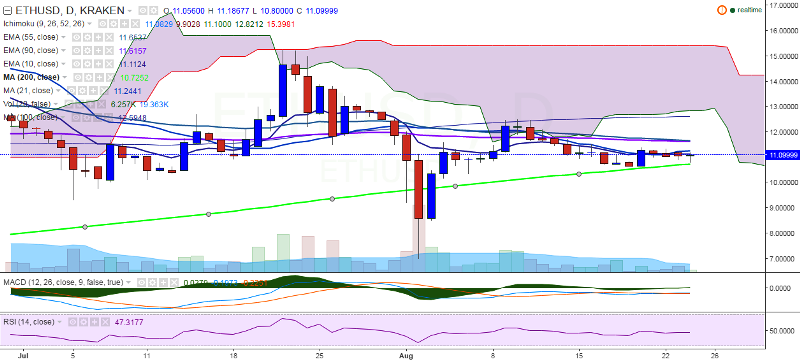
ETH/USD is trading in a narrow range on Wednesday, between 10.80 and 11.18 levels. The pair has taken support near 200-day MA and is currently trading at 11.14 levels, at the time of writing (Kraken).
Ichimoku analysis of daily chart:
Tenkan Sen: 11.08
Kijun Sen: 9.94
Trend reversal: 11.62 (90 EMA)
“The pair has fallen to 10.80 levels, after hitting 11.38 levels (Aug 20 high). ETH/USD should close above 90 EMA for further upward trend”, FxWirePro said in a statement.
On the topside, the pair faces major resistance at 11.62 (90 EMA) and a break above would see the pair testing 12.59 (100-day MA)/13.63 (161.8% retracement of 12.49 and 10.67). On the downside, 200-day MA (10.68 levels) is providing strong support to the pair. A consistent break below this major trend line will see the pair plunging to 9.10 (61.8% retracement of 7 and 12.49)/7.00 (August 2 low).

- News

- Economy

- Central Banks
- Investing
- Research
- Roundups
- Digital Currency
- Insights
- Technical Analysis
- Technology
- Business
- Law
- Health
- Nature
- Fintech
- Science
- Topic
- Opinions
- ©Econometrics LLC . All Rights Reserved.
ETH/USD continues choppy trade, break above 90-day EMA confirms bullishness
Wednesday, August 24, 2016 11:34 AM UTC
Editor's Picks


- Market Data
Most Popular


