


 Ethereum Cracks Under $1,700: Sell the Rally Near $1,750 as Bears Eye $1,380–$1,200
  FxWirePro- Major Crypto levels and bias summary
  FxWirePro- Major Crypto levels and bias summary


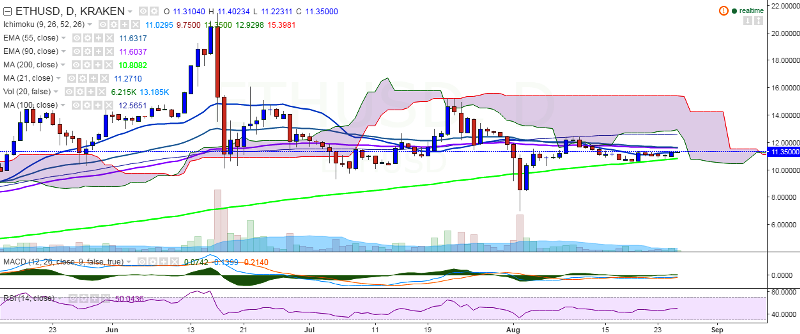
ETH/USD closed above 21-day MA on Thursday, which suggests a minor bullish trend in the pair. It is currently trading at 11.35 levels at the time of writing (Kraken).
Ichimoku analysis of daily chart:
Tenkan Sen: 11.01
Kijun Sen: 9.75
Trend reversal: 11.60 (90-day EMA)
“The pair has bounced back after taking support near 200-day MA and is struggling to sustain above 21-day MA. ETH/USD should close above 90 EMA for further upside”, FxWirePro said in a statement.
On the topside, major resistance is seen at 11.60 (90-day EMA) and further strength would push the pair to 12.58 (100-day MA)/ 13.64 (161.8% retracement of 12.49 and 10.65). On the reverse side, the pair faces strong support at 10.76 (200-day MA) and a break below will take the pair to 9.10 (61.8% retracement of 7 and 12.49)/7.00 (August 2 low).

- News

- Economy

- Central Banks
- Investing
- Research
- Roundups
- Digital Currency
- Insights
- Technical Analysis
- Technology
- Business
- Law
- Health
- Nature
- Fintech
- Science
- Topic
- Opinions
- ©Econometrics LLC . All Rights Reserved.
ETH/USD breaks above 21-day MA, eyes 12.00
Friday, August 26, 2016 10:41 AM UTC
Editor's Picks


- Market Data
Most Popular


