


 FxWirePro: GBP/USD hits one-month high, scope for further upside
  FxWirePro- Major Crypto levels and bias summary
  ETH Stands Alone Bullish; BTC, SOL, XRP, BNB Neutral
  EUR/USD Holds Bullish Tone Despite Pullback from Yesterday’s High
  Morgan Stanley Says China’s Reusable Rocket Progress Poses Long-Term Challenge to SpaceX
  Goldman Sachs Flags 3 Key Risks Ahead of Europe’s Earnings Season
  JPY Action Bias: Extremely Bullish Surge Ignites Across NZD, GBP & AUD
  Crypto Major Pair Action Bias: ETHUSD Bullish as BTCUSD, SOLUSD & XRPUSD Stay Neutral
  FxWirePro- Major Crypto levels and bias summary


The year-2018 has been bearish rout for bitcoin price, during that phase, BTC price showed steep slumps and year-2019 has been mixed bag of sentiments, we could see no traces of slowing in its dominance as 2019.
At the beginning of the year, BTCUSD price surged from the lows of $3,122 to the recent highs of $13,880 levels (i.e. mammoth returns of 344 in percentage terms that too within a span of 6 months or so, refer 1stchart).
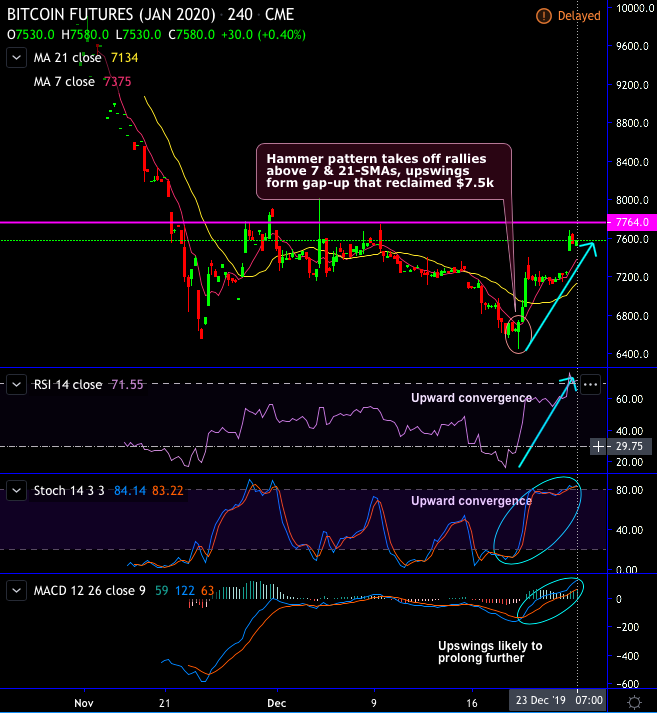
Although Year-2019 has been instrumental for bitcoin exchanges, crypto-traders and investors, it has been little turbulent. However, such robust uptrend has generated various price gaps in the CME Bitcoin futures contracts (refer 1st chart). Hammer pattern takes off rallies above 7 & 21-SMAs, the upswings form gap-up that reclaimed $7.5k.
Technically, Shooting star plummets prices below EMAs, both leading oscillators in tandem with price slumps in intermediate trend of BTCUSD, the underlying price has retraced 61.8% Fibonacci levels that has wiped off most of the gains in the year-2019. Whereas the slumps have halted at that juncture and showing some strong supports. As a result, hammer pattern occurred at $7,509 levels to counter.
We could see the stiff resistance levels at $7,764 levels, if bulls manage to breakout these levels decisively, then we could foresee more upside traction easily upto $8.5k levels. Thus, we add fresh longs at spot level for targets upto $8.5k levels with strict stop loss of $7,085 levels.


