


 FxWirePro- Major Crypto levels and bias summary
  FxWirePro: NZD/USD trades in narrow range ,outlook bullish
  ETHUSD Bullish Momentum: Follows BTC Above All EMAs, Buy Dips Near $1750 Targeting $2300
  FxWirePro: EUR/AUD outlook weaker on renewed downside pressure
  AUDJPY Bullish Surge: Strong Australian Dollar Fuels Fresh Upside as Pair Holds Above 113.50 and All EMAs Align
  Crypto Major Pair Action Bias: ETHUSD Bullish as BTCUSD, SOLUSD & XRPUSD Stay Neutral
  FxWirePro :USD/JPY bulls loosen their grip a bit, dips to be bought
  GBPUSD, AUDUSD & NZDUSD Turn Extremely Bullish: Strong Positive Momentum Drives Major Pair Action Bias
  ETH Stands Alone Bullish; BTC, SOL, XRP, BNB Neutral
  FxWirePro: GBP/NZD gains some upside momentum but still bearish
  FxWirePro: AUD/USD edges lower, but bullish outlook persists
  FxWirePro: NZD/USD steadies around 0.5830,retains bid tone


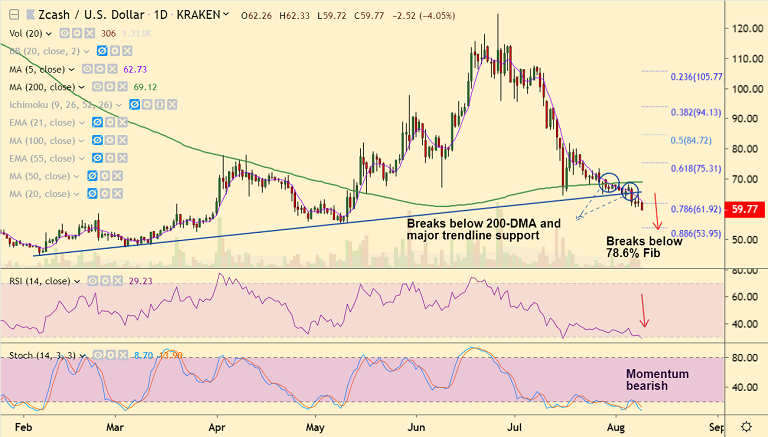
ZEC/USD chart - Trading View
Exchange - Kraken
Support: 53.95 (88.6% Fib); Resistance: 69.12 (200-DMA)
Technical Analysis: Bias Bearish
ZEC/USD was trading 3.72% lower on the day at 59.97 at 10:00 GMT, bias is bearish.
'Gravestone Doji' on previous day's candle shows selling pressure at highs, plummets prices.
GMMA indicator and the Parabolic SAR suggest extension of downtrend. Momentum studies are bearish.
The pair has slipped below 78.6% Fib and eyes next major support at 55.24 (May 9th lows) ahead of 88.6% Fib at 53.95.
5-DMA is immediate resistance at 62.76. Retrace above 200-DMA (69.12) negates near-term bearishness.


