


 Major Pair Action Bias: Extremely Bullish Surge Powers GBPUSD & NZDUSD as Bullish Momentum Ignites
  FxWirePro: EUR/AUD outlook weaker on renewed downside pressure
  FxWirePro- Major Crypto levels and bias summary
  FxWirePro- Major Crypto levels and bias summary
  FxWirePro- Major Crypto levels and bias summary
  GBPJPY Bullish Surge: Strong Pound Ignites Fresh Upside on Fed-BOE Policy Divergence as All EMAs Align
  Crypto Major Pair Action Bias: ETHUSD Bullish as BTCUSD, SOLUSD & XRPUSD Stay Neutral
  JPY Action Bias: Extremely Bullish Surge Ignites Across NZD, GBP & AUD
  ETH Stands Alone Bullish; BTC, SOL, XRP, BNB Neutral
  FxWirePro: USD/JPY uptrend loses steam, remains on bullish path


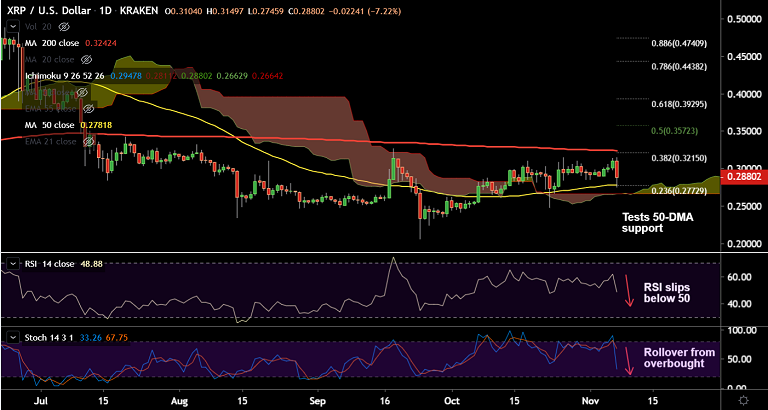
XRP/USD chart - Trading View
Exchange - Kraken
Support: 0.2781 (50-DMA); Resistance: 0.3242 (200-DMA)
Technical Analysis: Bias turning bearish
XRP/USD has slumped over 9% on the day to hit 2-week lows at 0.2745.
The pair has erased some losses and was trading at 0.2879, down 7.24% at 11:55 GMT.
A 'Bearish Engulfing' pattern on the daily charts has raised scope for weakness.
Technical studies on the daily charts are turning bearish. Stochs and RSI have turned lower, RSI has slipped below 50.
Price action has been struggling to break above 21W EMA from the past 4 weeks.


