


 Crypto Major Pair Action Bias: ETHUSD Bullish as BTCUSD, SOLUSD & XRPUSD Stay Neutral
  FxWirePro: AUD/USD edges lower, but bullish outlook persists
  Major Pair Action Bias: Extremely Bullish Surge Powers GBPUSD & NZDUSD as Bullish Momentum Ignites
  FxWirePro: NZD/USD trades in narrow range ,outlook bullish
  GBPJPY Bullish Surge: Strong Pound Ignites Fresh Upside on Fed-BOE Policy Divergence as All EMAs Align
  FxWirePro- Woodies pivot (Major)
  ETH Stands Alone Bullish; BTC, SOL, XRP, BNB Neutral
  FxWirePro:EUR/NZD dips below lower range, bearish bias increases
  EUR/USD Holds Bullish Tone Despite Pullback from Yesterday’s High


, bearish bias to drag prices lower - EconoTimes)


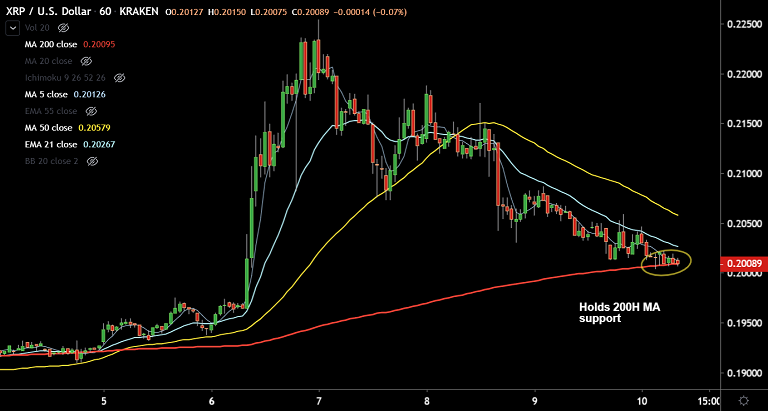
XRP/USD chart - Trading View
Exchange - Kraken
Technical Analysis: Bias Bearish
GMMA Indicator: Major Trend - Bearish; Minor Trend - Bearish
Overbought/ Oversold Index: Neutral
Support: 0.2009 (200H MA); Resistance: 0.2087 (50-DMA)
XRP/USD was trading 1.51% lower on the day at 0.2007 at 08:45 GMT, bias has turned bearish.
The pair is extending weakness for the 4th straight session, technical studies support more downside.
Stochs and RSI are now biased lower. RSI has slipped below the 50 mark. Stochastics RSI shows rollover from overbought levels.
Major trend has been bearish and minor trend has also shifted to bearish with short-term moving averages turning south.
The pair is holding support at 21-EMA (0.2013) and 200H MA at 0.2009. Break below will see further downside.
Next immediate support lies at 20-DMA at 0.1963 ahead of 0.1740 (Dec 18th low). Decisive break above 55-EMA (0.2155) required for any meaningful upside.


