


 FxWirePro- Woodies pivot (Major)
  FxWirePro: GBP/NZD gains some upside momentum but still bearish
  Gold Loses Steam After Strong U.S. Retail Sales
  FxWirePro: EUR/AUD outlook weaker on renewed downside pressure
  ETHUSD Bullish Momentum: Follows BTC Above All EMAs, Buy Dips Near $1750 Targeting $2300
  Crypto Major Pair Action Bias: ETHUSD Bullish as BTCUSD, SOLUSD & XRPUSD Stay Neutral
  AUDJPY Bullish Surge: Strong Australian Dollar Fuels Fresh Upside as Pair Holds Above 113.50 and All EMAs Align
  FxWirePro :USD/JPY bulls loosen their grip a bit, dips to be bought
  AUDJPY Extremely Bullish Above 113: Strong AUD Fuels Fresh Rally – Buy Dips at 113 Targeting 115
  ETH Stands Alone Bullish; BTC, SOL, XRP, BNB Neutral
  NZDJPY Bullish Surge: Strong Kiwi Ignites Fresh Upside as 94 Support Holds and All EMAs Align
  GBPUSD, AUDUSD & NZDUSD Turn Extremely Bullish: Strong Positive Momentum Drives Major Pair Action Bias


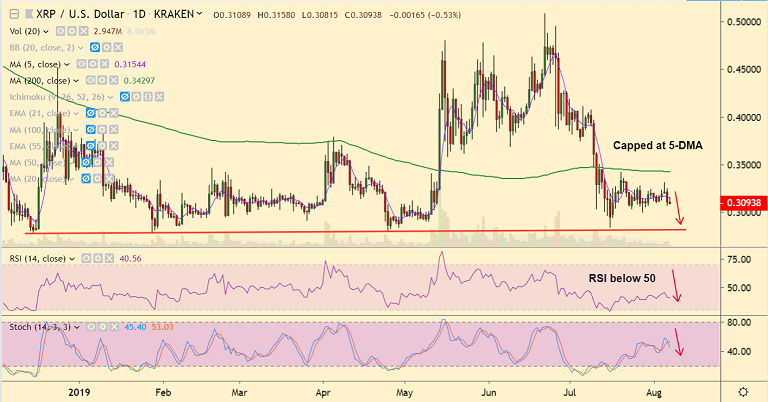
XRP/USD chart - Trading View
Exchange - Kraken
Support: 0.2820 (Trendline); Resistance: 0.3222 (21-EMA)
Technical Analysis: Bias turning bearish
XRP/USD is extending weakness for the second straight session, bias is turning bearish.
Price action has been grinding sideways after break below 200-DMA.
Upside recovery finds strong selling pressure as evidenced by 'Inverted Hammer' formation.
RSI is below 50 and GMMA shows major trend has shifted to bearish.
Stochastics RSI is at overbought levels and on verge of rollover into neutral.
Expect prices to fall in sync. Scope for test of major trendline support at 0.2820.
21-EMA is strong resistance at 0.3222. Break above 200-DMA (0.3429) could negate near-term bearishness.


