


 FxWirePro- Major Crypto levels and bias summary
  Crypto Major Pair Action Bias: ETHUSD Bullish as BTCUSD, SOLUSD & XRPUSD Stay Neutral
  FxWirePro- Major Crypto levels and bias summary
  FxWirePro- Major Crypto levels and bias summary
  FxWirePro: EUR/AUD outlook weaker on renewed downside pressure
  FxWirePro: USD/ZAR advances as South African rand weakens amid renewed Middle East tensions
  FxWirePro- Woodies pivot (Major)
  FxWirePro: GBP/NZD gains some upside momentum but still bearish
  AUDJPY Bullish Surge: Strong Australian Dollar Fuels Fresh Upside as Pair Holds Above 113.50 and All EMAs Align
  Major Pair Action Bias: Extremely Bullish Surge Powers GBPUSD & NZDUSD as Bullish Momentum Ignites
  JPY Action Bias: Extremely Bullish Surge Ignites Across NZD, GBP & AUD
  FxWirePro: NZD/USD trades in narrow range ,outlook bullish
  FxWirePro:EUR/NZD dips below lower range, bearish bias increases
  Gold Loses Steam After Strong U.S. Retail Sales


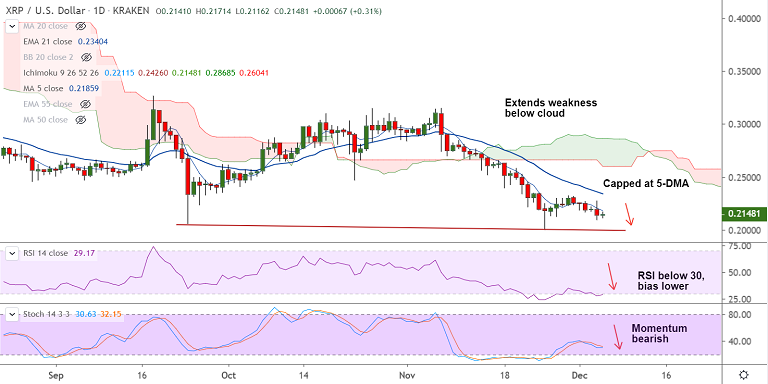
XRP/USD chart - Trading View
Exchange - Kraken
Support: 0.1995 (Trendline); Resistance: 0.2223 (200H MA)
Technical Analysis: Bias Bearish
XRP/USD was trading largely rangebound on the day at 0.2148 at 07:00 GMT, after closing 2.49% lower in the previous session.
The pair is extending weakness below 5-DMA and is on track to test trendline support at 0.1995.
Technical indicators have turned bearish, Stochs and RSI have turned bearish. MACD is well in the negative territory.
'Death Cross' (bearish 50-DMA crossover on 200-DMA) on the hourly charts plummets prices further.
Price action is below cloud and major moving averages. Major and minor trend are bearish as shown by the GMMA indicator.
Next support lies at lower BB at 0.2013. Break below will see test of strong trendline support at 0.1995.


