


 FxWirePro: USD/JPY uptrend loses steam, remains on bullish path
  FxWirePro- Major Crypto levels and bias summary
  ETH Stands Alone Bullish; BTC, SOL, XRP, BNB Neutral
  NZDJPY Bullish Surge: Strong Kiwi Ignites Fresh Upside as 94 Support Holds and All EMAs Align
  Major Pair Action Bias: Extremely Bullish Surge Powers GBPUSD & NZDUSD as Bullish Momentum Ignites
  EUR/USD Holds Bullish Tone Despite Pullback from Yesterday’s High
  GBPUSD, AUDUSD & NZDUSD Turn Extremely Bullish: Strong Positive Momentum Drives Major Pair Action Bias
  Gold Loses Steam After Strong U.S. Retail Sales
  GBPJPY Bullish Surge: Strong Pound Ignites Fresh Upside on Fed-BOE Policy Divergence as All EMAs Align
  FxWirePro: EUR/AUD outlook weaker on renewed downside pressure


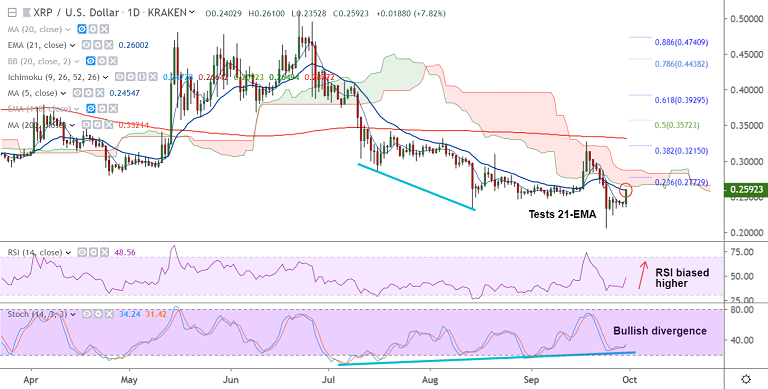
XRP/USD chart - Trading View
Exchange - Kraken
Support: 0.2456 (5-DMA); Resistance: 0.2657 (50-DMA)
Technical Analysis: Bias turning slightly bullish
XRP/USD shows a sudden spike, breaks past 200H SMA to hit 6-day high at 0.2607.
The pair is extending break above 200H SMA, has test 21-EMA resistance at 0.2600.
RSI has turned higher, 'Bullish Divergence' to support more gains.
Major trend is bearish as indicated by the GMMA indicator. Decisive break above 21-EMA with shift in short-term MAs could change dynamics for the pair.
Next major resistance lies at cloud base (0.2649). Break above eyes 23.6% Fib at 0.2772.
On the flipside, failure at 21-EMA and retrace below 200H SMA negates bullish bias.


