


 Crypto Major Pair Action Bias: ETHUSD Bullish as BTCUSD, SOLUSD & XRPUSD Stay Neutral
  FxWirePro: USD/JPY uptrend loses steam, remains on bullish path
  ETH Stands Alone Bullish; BTC, SOL, XRP, BNB Neutral
  NZDJPY Bullish Surge: Strong Kiwi Ignites Fresh Upside as 94 Support Holds and All EMAs Align
  Gold Loses Steam After Strong U.S. Retail Sales
  FxWirePro: USD/ZAR advances as South African rand weakens amid renewed Middle East tensions
  GBPJPY Bullish Surge: Strong Pound Ignites Fresh Upside on Fed-BOE Policy Divergence as All EMAs Align
  FxWirePro: GBP/USD hits one-month high, scope for further upside
  FxWirePro- Major Crypto levels and bias summary
  FxWirePro: AUD/USD edges lower, but bullish outlook persists


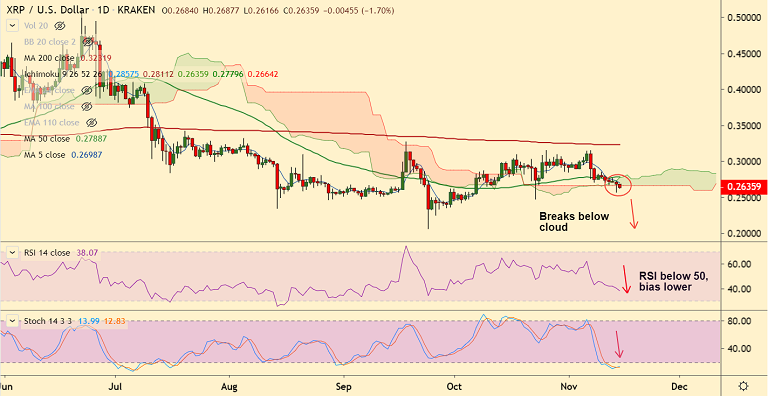
XRP/USD chart - Trading View
Exchange - Kraken
Support: 0.2472 (Oct 21 low); Resistance: 0.2745 (100-DMA)
Technical Analysis: Bias Strongly Bearish
XRP/USD is extending weakness for the 6th straight session, bias strongly bearish.
The pair was trading 1.74% lower at 0.2634 at 06:45 GMT after closing 1.31% lower in the previous session.
Price action has slipped below daily cloud raising scope for further weakness.
Technical indicators have turned bearish. Stochs and RSI are sharply lower and RSI is well below 50 mark.
Volatility is rising. MACD and ADX support weakness. GMMA indicator shows bearish shift in short-term trend.
Next supports on the downside lies at 0.2472 (Oct 21 low) ahead of lower weekly Bollinger band at 0.2203.
5-DMA is immediate resistance at 0.2698, break above will see gains till 55-EMA at 0.2820.


