


 FxWirePro- Major Crypto levels and bias summary
  FxWirePro- Major Crypto levels and bias summary
  GBPUSD, AUDUSD & NZDUSD Turn Extremely Bullish: Strong Positive Momentum Drives Major Pair Action Bias
  ETH Stands Alone Bullish; BTC, SOL, XRP, BNB Neutral
  FxWirePro: GBP/USD hits one-month high, scope for further upside
  Crypto Major Pair Action Bias: ETHUSD Bullish as BTCUSD, SOLUSD & XRPUSD Stay Neutral
  FxWirePro: USD/JPY uptrend loses steam, remains on bullish path
  FxWirePro- Major Crypto levels and bias summary
  FxWirePro: NZD/USD steadies around 0.5830,retains bid tone
  EUR/USD Holds Bullish Tone Despite Pullback from Yesterday’s High


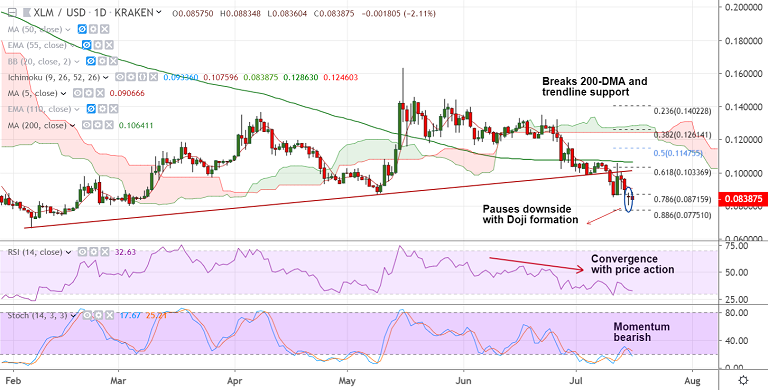
XLM/USD chart - Trading View
Exchange - Kraken
Support: 0.08 (Mar 4th low); Resistance: 0.0911 (5-DMA)
Technical Analysis: Bias Bearish
XLM/USD trades 1.62% lower on the day at 0.0842 at 12:50 GMT, major trend is bearish.
The pair has retraced from session highs at 0.0883, scope for further downside.
Price action extending weakness below 200-DMA. Convergence of RSI with price action adds to downside pressure.
The pair is attempting minor recovery after Doji formation on Monday's candle.
However, recovery attempts lack traction. Upside rejected at session highs.
Next major support lies at 88.6% Fib at 0.0775. Break below eyes 2019 lows at 0.0665.
For details on FxWirePro's Currency Strength Index, visit http://www.fxwirepro.com/currencyindex.


