


 FxWirePro- Major Crypto levels and bias summary
  FxWirePro: USD/CAD falls after BoC rate hold and weak U.S. producer inflation
  FxWirePro- Woodies pivot (Major)
  FxWirePro- Major Crypto levels and bias summary
  Crypto Major Pair Action Bias: ETHUSD Bullish as BTCUSD, SOLUSD & XRPUSD Stay Neutral
  FxWirePro: GBP/USD hits one-month high, scope for further upside
  GBPUSD, AUDUSD & NZDUSD Turn Extremely Bullish: Strong Positive Momentum Drives Major Pair Action Bias
  FxWirePro: USD/ZAR advances as South African rand weakens amid renewed Middle East tensions


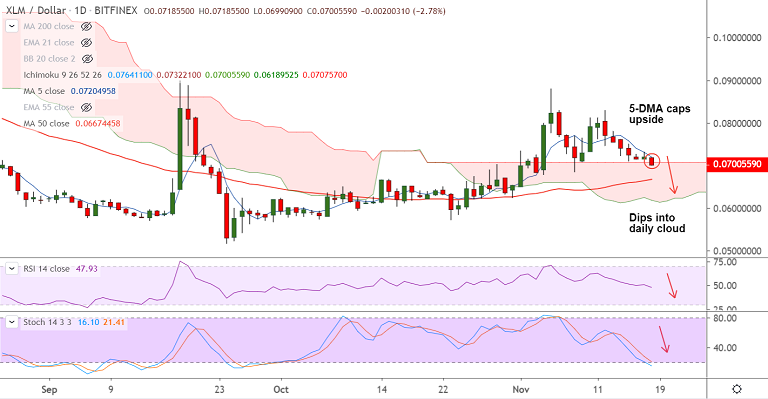
XLM/USD chart - Trading View
Exchange - Bitfinex
Support: 0.0693 (55-EMA); Resistance: 0.0721 (converged 5-DMA and 21-EMA)
Technical Analysis: Bias Bearish
XLM/USD slips into daily cloud, technical studies bearish, more weakness on charts.
The pair was trading 2.78% lower at 0.07005 around 11:00 GMT, after closing 0.67% higher in the previous session.
Technical indicators are biased lower. Stochs and RSI are sharply lower and RSI is well below 50 mark.
Price action has resumed weakness and is on track to test 50-DMA (currently at 0.0667).
5-DMA is immediate resistance at 0.07205. Retrace above 21-EMA could see minor upside.


