


 AUDJPY Extremely Bullish Above 113: Strong AUD Fuels Fresh Rally – Buy Dips at 113 Targeting 115
  FxWirePro- Major Crypto levels and bias summary
  FxWirePro: AUD/USD remains buoyant, looks to extend gains
  ETH Stands Alone Bullish; BTC, SOL, XRP, BNB Neutral
  FxWirePro- Major Crypto levels and bias summary
  EUR/USD Holds Bullish Tone Despite Pullback from Yesterday’s High
  GBPJPY Bullish Surge: Strong Pound Ignites Fresh Upside on Fed-BOE Policy Divergence as All EMAs Align
  FxWirePro: USD/JPY uptrend loses steam, remains on bullish path


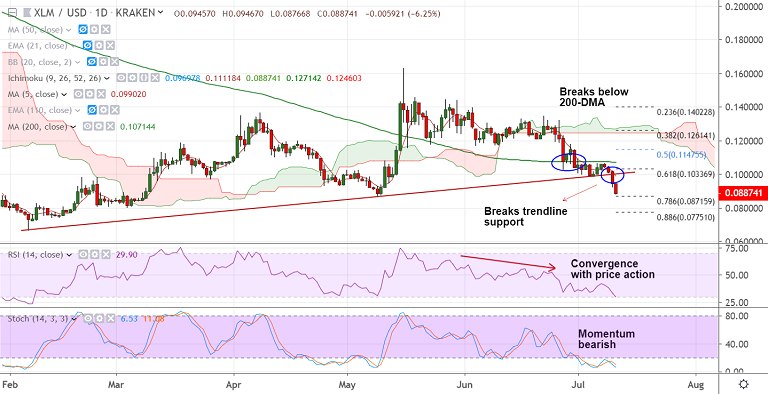
XLM/USD chart - Trading View
Exchange - Kraken
Support: 0.0862 (May 9 low); Resistance: 0.0991 (5-DMA)
Technical Analysis: Bias Bearish
XLM/USD has broken strong trendline support, bias is strongly bearish.
The pair has hit 9-week lows at 0.0876, and is currently trading at 0.0893 at 07:20 GMT.
Technical analysis shows further weakness in the pair. Price action extending weakness below 200-DMA.
Volatility is rising and RSI nicely converging with price action. ADX is rising in support of downside.
Markets look forward to Stellar's Meridian Conference event scheduled in Nov for cues to boost value.
For now, bears eye 0.08 (Mar 2019 low). Further weakness will see test of 0.0775 (88.6% Fib).
Immediate resistance is seen at 5-DMA at 0.0990. Break above 200-DMA required for upside continuation.
For details on FxWirePro's Currency Strength Index, visit http://www.fxwirepro.com/currencyindex.


