


 Major Pair Action Bias: Extremely Bullish Surge Powers GBPUSD & NZDUSD as Bullish Momentum Ignites
  Gold Loses Steam After Strong U.S. Retail Sales
  AUDJPY Bullish Surge: Strong Australian Dollar Fuels Fresh Upside as Pair Holds Above 113.50 and All EMAs Align
  FxWirePro:EUR/NZD dips below lower range, bearish bias increases
  FxWirePro: EUR/AUD outlook weaker on renewed downside pressure
  GBPJPY Bullish Surge: Strong Pound Ignites Fresh Upside on Fed-BOE Policy Divergence as All EMAs Align


 resumes weakness, break below 20-DMA could see fresh multi-month lows - EconoTimes)


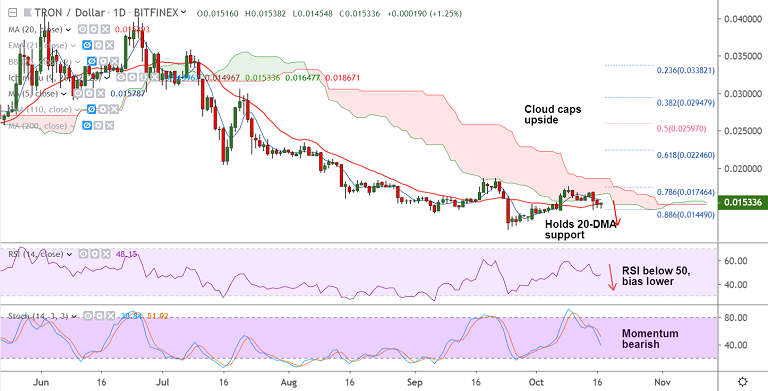
TRX/USD chart - Trading View
Exchange - Bitfinex
Support: 0.014490 (88.6% Fib); Resistance: 0.016547 (55-EMA)
Technical Analysis: Bias bearish
TRON (TRX) has been extending gradual grind lower after upside was capped at daily cloud.
Technical indicators on the daily charts are biased lower. RSI below 50 and stochs are sharply lower.
5-DMA has turned indicating near-term downside. TRX/USD is holding support at 20-DMA (0.015291).
Break below 20-DMA will see resumption of downside. Test of fresh multi-month lows likely.
Failure to break below 20-DMA could see further consolidation. Breakout above cloud will invalidate any bearish bias.


