


 ETH Stands Alone Bullish; BTC, SOL, XRP, BNB Neutral
  GBPJPY Bullish Surge: Strong Pound Ignites Fresh Upside on Fed-BOE Policy Divergence as All EMAs Align
  FxWirePro- Major Crypto levels and bias summary
  NZDJPY Bullish Surge: Strong Kiwi Ignites Fresh Upside as 94 Support Holds and All EMAs Align
  Crypto Major Pair Action Bias: ETHUSD Bullish as BTCUSD, SOLUSD & XRPUSD Stay Neutral
  FxWirePro- Woodies pivot (Major)
  FxWirePro: NZD/USD trades in narrow range ,outlook bullish


 fails at 20-DMA, squashes hope for recovery - EconoTimes)


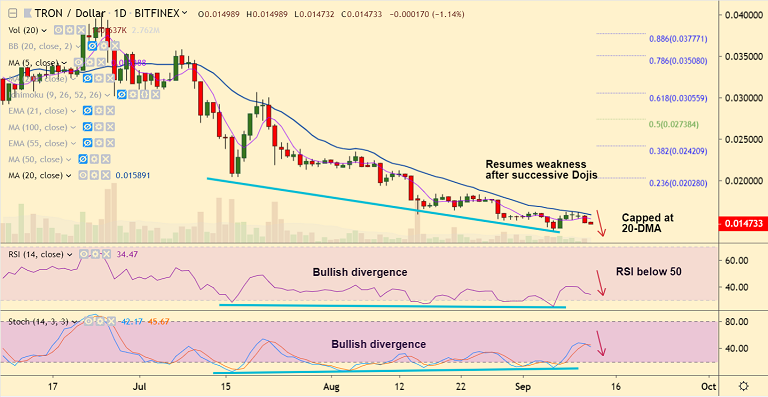
TRX/USD chart - Trading View
Exchange - Bitfinex
Support: 0.013951 (Lower BB); Resistance: 0.015891 (20-DMA)
Technical Analysis: Bias Bearish
TRON (TRX) resumes weakness after rejection at 20-DMA resistance.
TRX/USD was trading at 0.014733 at 02:25 GMT, down 1.14% at the time of writing.
Successive 'Doji' formation seen at 20-DMA resistance. The pair has slipped below 5-DMA.
Major trend has been bearish and minor recovery hopes squashed after failure at 20-DMA.
Stochs and RSI are now biased lower and Stochastics RSI is showing rollover from overbought levels.
Scope for dip till lower Bollinger band at 0.013951 and further weakness may see test of 0.0111 (2018 lows).
'Bullish divergence' on RSI and Stochastics seen. However, upside only on break above 21-EMA.


