


 FxWirePro- Woodies pivot (Major)
  FxWirePro: GBP/NZD gains some upside momentum but still bearish
  FxWirePro- Major Pair levels and bias summary
  ETHUSD Bullish Momentum: Follows BTC Above All EMAs, Buy Dips Near $1750 Targeting $2300
  ETH Stands Alone Bullish; BTC, SOL, XRP, BNB Neutral
  JPY Action Bias: Extremely Bullish Surge Ignites Across NZD, GBP & AUD
  FxWirePro- Major Crypto levels and bias summary
  FxWirePro: AUD/USD edges lower, but bullish outlook persists
  Gold Loses Steam After Strong U.S. Retail Sales
  FxWirePro: EUR/AUD outlook weaker on renewed downside pressure


 bullish breakout above cloud and 110-EMA, next bull target 200-DMA (0.023497) - EconoTimes)


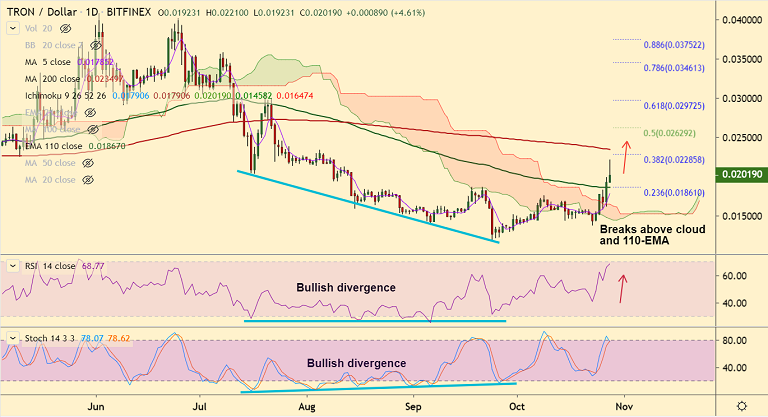
TRX/USD chart - Trading View
Exchange - Coinbase
Support: 0.018670 (110-EMA); Resistance: 0.023497 (200-DMA)
Technical Analysis: Bias Bullish
TRX/USD has sealed upside with bullish breakout above 110-EMA and daily cloud.
The pair has hit 12-week highs at 0.022100 (highest since Aug 9th) before paring some gains to trade at 0.020159 at 08:30 GMT.
Bias has turned bullish with the pair confirming breakout above 110-EMA and daily cloud.
Momentum studies are bullish, RSI is sharply higher and volatility is rising as shown bu widening Bollinger bands.
Next bull target lies at 200-DMA at 0.023497. Breakout above confirms further gains.
Immediate support lies at 110-EMA at 0.018670. Retrace below daily cloud negates bullish bias.


