


 Bitcoin Consolidates Near $78K: Will Strong ETF Inflows Trigger a Breakout to $90K?
  FxWirePro- Woodies Pivot (Major)
  FxWirePro: USD/CAD firms slightly, but downward resumption looks likely
  FxWirePro: EUR/AUD dips below 1.6200 level ,vulnerable to more downside
  FxWirePro- Major Pair levels and bias summary
  FxWirePro- Major Pair levels and bias summary
  FxWirePro- Major Crypto levels and bias summary
  NZDJPY Consolidates, Resistance at 90.78 May Signal Favorability for Downtrend
  FxWirePro- Major Crypto levels and bias summary
  FxWirePro: USD/JPY slips as yen firms after hot Japan's wholesale inflation data


 breaks 21-EMA resistance, rising volatility and bullish divergence to ensure upside continuation - EconoTimes)


 Add as a preferred source on Google
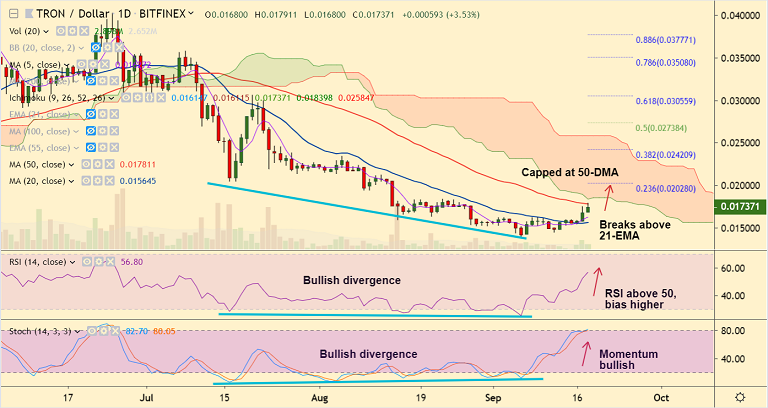
TRX/USD chart - Trading View
Exchange - Bitfinex
Support: 0.016200 (21-EMA); Resistance: 0.017815 (50-DMA)
Technical Analysis: Bias Bullish
TRX/USD was trading 4.28% higher on the day at 0.017496 at 09:30 GMT.
The pair is extending a breakout above 21-EMA resistance, bias remains bullish.
Major trend is bearish, but we see turn in indicators on the daily charts. Volatility is rising.
Stochs and RSI are sharply higher and bullish 5-DMA crossover on 20-DMA supports near-term uptrend.
Further, the pair shows bullish divergence on RSI and Stochs which adds to the bullish bias.
50-DMA offers stiff resistance at 0.017811. Break above will see further gains. Next bull target lies at 23.6% Fib at 0.020280
Immediate support lies at 5-DMA at 0.016272. Retrace below 21-EMA will negate near-term bullish bias.







