


 FxWirePro- Major Crypto levels and bias summary
  Sterling Slump Sends GBPJPY Toward 212.60 — Bearish EMA Stack Eyes 210
  FxWirePro: USD/ZAR remains buoyant, looks to extend gains
  BTC’s Bear Bounce: Sell the Rally Near $66K as Bears Target $59K–$52K Breakdown
  AUDJPY Breaks Key Trendline Support — Bears Eye 110 as Momentum Accelerates
  FxWirePro: USD/JPY edges higher as the yen remains vulnerable despite repeated warnings of intervention.
  FxWirePro: NZD/USD downside pressure builds, key support level in focus
  BTC Slips Below $60K as Institutional Demand Dries Up — Bears Eye $59K Support, Rallies to $63K for Shorts
  Pound-Yen Pullback: GBP/JPY Slips Below Key EMAs as Sterling Weakness Fuels Bearish Bet on 210
  FxWirePro: GBP/USD slides toward critical support market reassesses UK political transition
  FxWirePro: GBP/AUD steadies around 0.9145 ,retains bid tone
  FxWirePro- Major Crypto levels and bias summary
  NZD/JPY Loses Its Shine: Kiwi Cracks Under Pressure as Bears Target 91.80


 edges higher from session lows at 0.2154, 'Hammer' at lows raises scope for minor gains - EconoTimes)


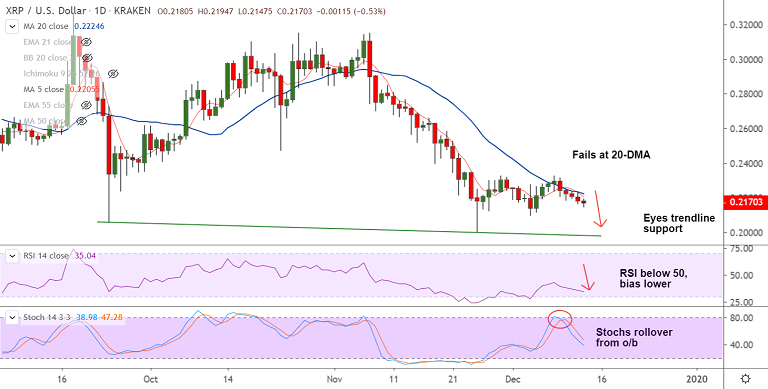
XRP/USD chart - Trading View
Exchange - Kraken
Support: 0.1975 (Trendline); Resistance: 0.2225 (20-DMA)
Technical Analysis: Bias Bearish
Ripple (XRP) is extending weakness for the 5th straight session, technical bias is strongly bearish.
XRP/USD was trading 0.49% lower on the day at 0.2171 at 10:30 GMT after closing 1.15% lower in the previous session.
The pair has edged higher from session lows at 0.2147 and a 'Hammer' formation on the 2H charts raises scope for upside.
That said, major and minor trend in the pair are bearish and technical indicators do not support upside as of now.
Lower Bollinger band offers immediate support at 0.2140. Scope for dip till trendline support at 0.1975.
5-DMA is immediate resistance at 0.2205. Break above eyes 20-DMA at 0.2225. Near-term bearish invalidation only above 21-EMA (0.2281).


