


 JPY Action Bias: Extremely Bullish Surge Ignites Across NZD, GBP & AUD
  FxWirePro: GBP/NZD gains some upside momentum but still bearish
  FxWirePro- Major Pair levels and bias summary
  FxWirePro:EUR/NZD dips below lower range, bearish bias increases
  Crypto Major Pair Action Bias: ETHUSD Bullish as BTCUSD, SOLUSD & XRPUSD Stay Neutral
  EUR/USD Holds Bullish Tone Despite Pullback from Yesterday’s High
  Gold Loses Steam After Strong U.S. Retail Sales
  Major Pair Action Bias: Extremely Bullish Surge Powers GBPUSD & NZDUSD as Bullish Momentum Ignites
  FxWirePro- Major Crypto levels and bias summary
  FxWirePro: GBP/USD under pressure despite UK's modest economic growth


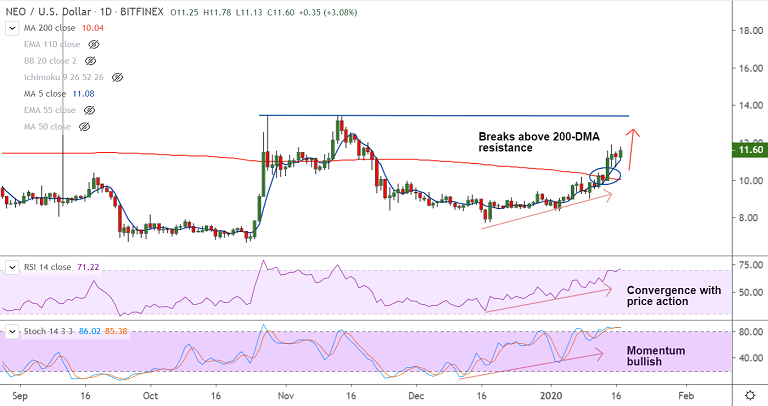
NEO/USD chart - Trading View
Exchange - Bitfinex
Technical Analysis: Bullish
GMMA Indicator: Major Trend - Bullish; Minor Trend - Bullish
Overbought/ Oversold Index: Overbought
Volatility: High and Rising
Support: 11.08 (5-DMA); Resistance: 12.30 (Upper BB (W))
NEO/USD is showing signs of a bullish trend shift, price set to scale new heights.
The pair was trading 2.79% higher on the day at 11.56 at around 09:35 GMT, bias bullish.
GMMA indicator shows shift in near and long term trend to bullish. Short-term MAs have crossed over long-term MAs and long-term MAs have turned north.
Price action has shown a breakout above daily cloud and 200-DMA resistance supporting the uptrend.
Volatility is rising, convergence of price action with oscillators and support from MACD and ADX suggests the pair is set to scale new highs.
Price action is extending break above 21W EMA and eyes upper BB (W) at 12.30 ahead of 55W EMA at 13.98.
5-DMA is immediate support at 11.08. Break below will see dip till 200-DMA. Retrace below negates near-term bullish bias.


