


 Crypto Major Pair Action Bias: ETHUSD Bullish as BTCUSD, SOLUSD & XRPUSD Stay Neutral
  FxWirePro: USD/JPY uptrend loses steam, remains on bullish path
  GBPJPY Bullish on Consolidation: Holds Above 216 After 218 Top – Buy Dips at 217 Targeting 220
  FxWirePro: AUD/USD remains buoyant, looks to extend gains
  FxWirePro- Major Crypto levels and bias summary
  FxWirePro- Major Crypto levels and bias summary
  FxWirePro- Woodies pivot (Major)
  FxWirePro: NZD/USD trades in narrow range ,outlook bullish
  ETHUSD Bullish Momentum: Follows BTC Above All EMAs, Buy Dips Near $1750 Targeting $2300
  GBPJPY Bullish Surge: Strong Pound Ignites Fresh Upside on Fed-BOE Policy Divergence as All EMAs Align
  ETH Stands Alone Bullish; BTC, SOL, XRP, BNB Neutral


 breaks above 200-DMA, bias turning bullish - EconoTimes)


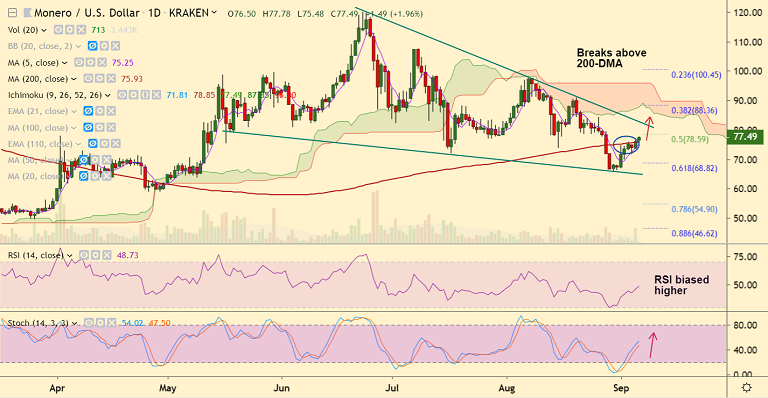
XMR/USD chart - Trading View
Exchange - Kraken
Support: 75.93 (200-DMA); Resistance: 82.75 (trendline)
Technical Analysis: Bias Bullish
XMR/USD has shown a break above 200-DMA after many days of consolidation below.
Technical indicators have turned bullish, scope for further upside.
Stochs and RSI have rolled over from oversold levels and are biased higher.
MACD is showing a bullish crossover on signal line and the pair has broken above major EMAs and cloud on the 4H charts.
Close above 200-DMA will take the pair higher, raising scope for test of trendline resistance at 82.75.
On the flipside, failure to hold above 200-DMA will see sideways trade for longer. Break below 5-DMA will see weakness in the pair.


