


 FxWirePro: USD/JPY slips as yen firms after hot Japan's wholesale inflation data
  FxWirePro- Major Crypto levels and bias summary
  FxWirePro- Major Crypto levels and bias summary
  Gold Loses Luster Amid Rising US Bond Yields, Iran Conflict; Sell on Rallies Advised
  FxWirePro- Major Crypto levels and bias summary
  AUDJPY Trades in Narrow Range, Bearish Indicators Suggest Selling on Rallies
  FxWirePro: GBP/NZD gains some upside momentum but still bearish
  FxWirePro- Major Pair levels and bias summary
  FxWirePro: USD/ZAR hits three-week high after hot U.S. PPI data


 Add as a preferred source on Google
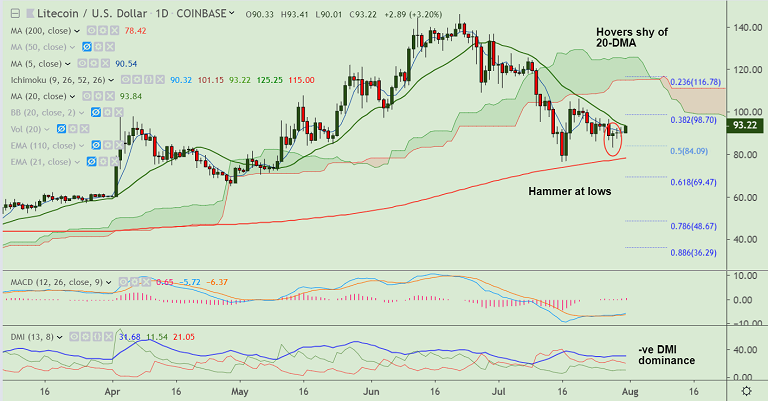
LTC/USD chart - Trading View
Exchange - Coinbase
Support: 90.52 (5-DMA); Resistance: 93.84 (20-DMA)
Technical Analysis: Bias Neutral
LTC/USD ends consolidation after successive doji formations in the previous 2 sessions.
The pair trades 3.07% higher at 93.10 at 10:55 GMT. Bias is turning slightly bullish on the intraday charts.
Price action has broken above 200-H SMA and 5-DMA, hovers shy of 20-DMA (93.84).
Breakout above 20-DMA will see further gains. Next major resistance lies at 21-EMA at 97.02.
Major trend is bearish. Upside will likely be limited. Break above 50-DMA could tilt the bias to bullish again.
For details on FxWirePro's Currency Strength Index, visit http://www.fxwirepro.com/currencyindex.







